Mapping Techniques for an Automated Library Classification: The Case Study of Library Loans at Bibliotheca Hertziana
@inproceedings{casey2024mapping,
  author      = {Hannah Laureen Casey and Alessandro Adamou and Dario Rodighiero},
  title       = {Mapping Techniques for an Automated Library Classification: The Case Study of Library Loans at Bibliotheca Hertziana},
  booktitle   = {Linking Theory and Practice of Digital Libraries},
  year        = {2024},
  url         = {https://zenodo.org/records/13862868}
}
This paper introduces an innovative analytical method for visualising research libraries, overcoming the limitations of the assumptions made by their classification systems. The approach combines user loan data with deep mapping techniques to graphically display usage patterns and thematic clusters. Dimensionality reduction is used to visualise the catalogue by book loans, and prompt engineering with large language models is used to describe loan clusters with detailed summaries and titles. This approach was applied to the library collection owned by Bibliotheca Hertziana, a renowned research institute for art history based in Rome. The final output was assessed by a group of experts through interviews supported by an atlas providing statistical information on clusters. This yielded promising results towards a more general framework for visually mapping textual collections and capturing their transformation and usage from an interdisciplinary perspective.
Introduction
Specialised libraries are known for adopting custom signature systems to classify their holdings, primarily because general classification systems like LCC, Dewey, or Biss do not delve in sufficient detail to make books easy to locate. When libraries are orientated to research, there is an expectation that their classification systems reflect or are useful for the scholarly areas relevant to their institutions. However, research areas are mutable and driven by highly specific topics from scholars, influenced in turn by factors such as their tenure or team size. The result is that classification systems struggle to match this dynamism, as their structure cannot be continuously reorganised without sacrificing backward compatibility. Consequently, they are often extended with further categorisation that stacks up with the existing structure and may not be as well documented as the criteria and categories that are in the classification for a longer period.
This situation inevitably affects the construction of visual interfaces for libraries. Data visualisation systems that do not rely upon predetermined nomenclatures find their usefulness in such contexts: mapping-based visualisations in particular have proven effective in academic environments where affinities with researcher profiles are sought (Rodighiero 2021). However, the question remains as to which features and relations should be captured to present a visualisation that renders emerging research areas that ageing classification systems do not represent. Whilst citation and co-authorship networks represent the most beaten path in that regard, further scholarly interactions can likewise function, especially when specific to the remit of libraries.
The objective of this study is to evaluate the feasibility of identifying and visualising significant areas and trends within a research institute, utilising library loan activity. Several challenging factors from the context in which a library operates are then to be considered, including but not limited to:
- Classification systems. As said earlier, in-house signature systems to organise books on shelves may be static, or continuously evolving at the expense of documentation. Also, the underlying criteria may reflect initial interests, failing to attest to their appropriateness for novel research areas.
- Loan policies. These regulations change over time and may apply different policies depending on whether users are members of the institute or not. These rules may, as they do in our case study, affect the number or duration of recorded loans.
- Data granularity. Is the item of a loan the edition of a book or its individual copy? If a user returns a book at the end of each day only to borrow it again the next day, how many loan activities does it count as? These factors are inevitably prone to skew loan activity intensity measures.
This approach groups the books of a library’s holdings in a two-dimensional space based on loan data. Human-readable descriptions of the clusters are then generated in a semi-automatic way by making use of Large Language Models (LLM) to which specific prompts were engineered.
This approach was implemented at Bibliotheca Hertziana, one of the leading European research institutes in art history.1 Its library presents several characteristics of the problem at hand, as it is specific to one theme, yet its coverage of it is affected by a multitude of factors, not all of which depend on the interests of senior scholars. The library also adopts a custom signature system, to which it continuously adds features that are yet to be documented, and has changed its loan policy and its way of recording loans in recent times.
To assess the effectiveness of the approach, a qualitative user evaluation was carried out. Interviews were conducted in Hertziana with stakeholders, including department heads and team leaders, who were asked to identify those clusters corresponding to their personal research or to other areas covered within the institute. This has yielded promising results that encourage us to continue leveraging the interactions of researchers with books.
The remainder of this paper is structured as follows. Section 2 reviews related work, exploring previous efforts in library classification and visualisation, highlighting their limitations and the need for innovative approaches. Section 3 describes the methodology, detailing the processes of mapping library loans and generating automated descriptions of book clusters using large language models. In Section 4, a comprehensive case study demonstrates the practical application and effectiveness of the approach. Section 5 discusses the evaluation of the methods through qualitative feedback from library stakeholders and quantitative analysis of visualisations and classifications. Finally, Section 6 concludes the paper by summarising the findings, discussing the implications for future research, and suggesting potential improvements for library classification systems.
Related Work
The evolution in information display demands a re-imagining of library spaces, finding creative ways to make them even more inspiring and accessible (Wilders 2017). Part of such re-imagining is understanding how books are organised and displayed in libraries.
Libraries aspire to motion, stimulation, and immersion in extraordinary environments (Stafford 2012). Dynamic classifications and collection displays should reflect these qualities, fostering reader curiosity by making visible intuitive connections between books. The key to obtaining a flexible library is to create a flexible classification; as mentioned by Geoffrey C. Bowker and Susan Leigh Star in their book Sorting Things Out, “only a living classification is a good classification” (Bowker and Star 2008, 326). The authors emphasise the possibility of conceiving a classification — and consequently a library display — that can be reconfigured at any time, considering the library as a fluid entity.
Given this context, a technology such as dimensionality reduction appears as a key resource in the landscape of digital humanities. As part of a novel information infrastructure, dimensionality reduction can enhance the accessibility and navigability of the library collection (Schmidt 2018). The rndr design studio, for example, created a visual system for library users to interact with 150,000 scientific publications at Delft University of Technology (RNDR 2022). In other case studies, cultural collections are visualised by employing machine learning techniques to group objects using visual analogy (Glinka et al. 2016; Pietsch 2020). Similarly, elements can be spaced by their textual information, applying the umap algorithm to measure semantic similarity (Noichl 2023; Picca et al. 2023). The resulting embedding can also be annotated using the highest scoring keywords from a tf-idf representation of the corpus (Noichl 2023).
These innovative ways of visualising information can significantly contribute to the mapping of science, a research field with a long tradition in the social dimension of science. The main instrument of this field is represented by network visualisations, which aim to show how disciplines are structurally regulated and how they relate to each other (Petrovich 2020). Usually, these networks rely on corpora of scientific literature, which are analysed using computational tools to then leave space for the interpretation of the resulting visual structures (Chen 2017). The structure of these mappings is often characterised by large central clusters representing the main areas of science, combined with small clusters that represent more specific disciplinary topics (Boyack, Klavans, and Börner 2005).
Co-citations, co-authorship, and inter-citations have often been used in science mapping to illustrate the connections between different fields (Lima 2011). Co-citation, for instance, establishes connections when two works appear in the same article, inter-citation is the count of times that any document cites any other, as well as itself (Börner, Chen, and Boyack 2003, 192). Moreover, dynamic changes in science, which can range from bursts of activity in one field following external events such as funding, are an area of investigation (Börner 2015). In Boyack, Klavans, and Börner (2005), intuitive mappings of the sciences based on around 7000 scientific journals are presented, using different similarity measures and evaluating the resulting mappings based on accuracy measures and readability of the layout.
Methodology Overview
The focus of this study is on mapping and visualising individual editions, referring to them generically as ‘books’. This term does not include copies of these editions or the works they represent. With this established, the applied method comprises two phases: in the first phase, the books are clustered in a two-dimensional space based on the users’ loans; in the second, cluster titles and descriptions are generated semi-automatically through engineering zero-shot prompts, i.e. without examples or demonstrations, to an LLM.
Data Visualisation
Mapping a library collection requires a measure of distance between books and a positioning technique to space them out in the two-dimensional space. Commonly used in mapping science or visualising cultural collections (Börner, Chen, and Boyack 2003, 193), traditional methods such as citation networks or text analysis proved unsuitable in the case study at hand; the main reason is identified in the unavailability of full texts — and consequently of references — for relational analysis. Also, the lack of a complete record of the signature system made a potential metric based on the local shelf numbering system unfortunately unsuitable as well. Luckily, library loans were the only measurement offering a valid alternative that has never been explored, leaving room to test the most advanced techniques of mapping with the Hertziana’s collection. Similarly to citation networks, library loans allow for measuring distance between books borrowed by the same users. The overall idea was to employ users’ activity as a metric to organise Bibliotheca Hertziana’s library collection into meaningful clusters of books. To demonstrate this approach, an example from the loan records will be utilised.
Procedural Steps. The proposed method proceeds as follows:
- Data Enrichment: Identify books and enrich them with related metadata.
- Matrix Generation: Construct a high-dimensional matrix with books and users, weighted by the number of loans.
- Dimensionality Reduction: Reduce the dimensionality of the matrix to a two-dimensional embedding characterised by clusters.
- Visual Mapping: Parametrisation of the embedding for interpretation.
Data Enrichment. A starting list of books is enriched with additional information about language, authors, subtitles, and other metadata. This initial operation simplifies the identification of different editions of same items. At this stage, some anomalies were identified and solved. For example, many items in the section ‘Periodicals’ have been borrowed a thousand times because the system records the general item, not the specific issue of magazines and journals. This choice makes the borrowing numbers seem much higher than they are, leading us to exclude from the analysis any document borrowed over 5,000 times.
Matrix Generation. Each book is described by a list of users, which stands for the number of times these users have borrowed that book. When considering users as terms, the tf-idf algorithm is used to give more importance to those users who have loaned specific books, possibly creating clustering around niche topics. The resulting matrix features a high-dimensional space, where books with users in common neighbour together. In a typical example, when one user borrows two books never borrowed by someone else, those books will be close to one another in the tf-idf representation.
Dimensionality Reduction. An unsupervised technique of machine learning called dimensionality reduction is used to translate the high dimensionality of books to two-dimensional coordinates. The algorithm Uniform Manifold Approximation and Projection (umap) (McInnes, Healy, and Melville 2018) was preferred over Principal Component Analysis (pca) or the T-distributed Stochastic Neighbour Embedding (t-sne). The reason for this choice is that umap is known to have no computational restrictions on embedding dimension, as demonstrated during the examination of similar projects (cf. Section 2). Umap makes it possible to map the entire collection of books in a two-dimensional plane, allowing for a complete knowledge organisation of the library. That said, what should be highlighted is that this operation of mapping can rarely be achieved perfectly, and its interpretability has recently led to criticism (Chari and Pachter 2023). Although interpreting the mapping must be done with care, this criticism does not necessarily undermine the effort to understand the collection through computational means.
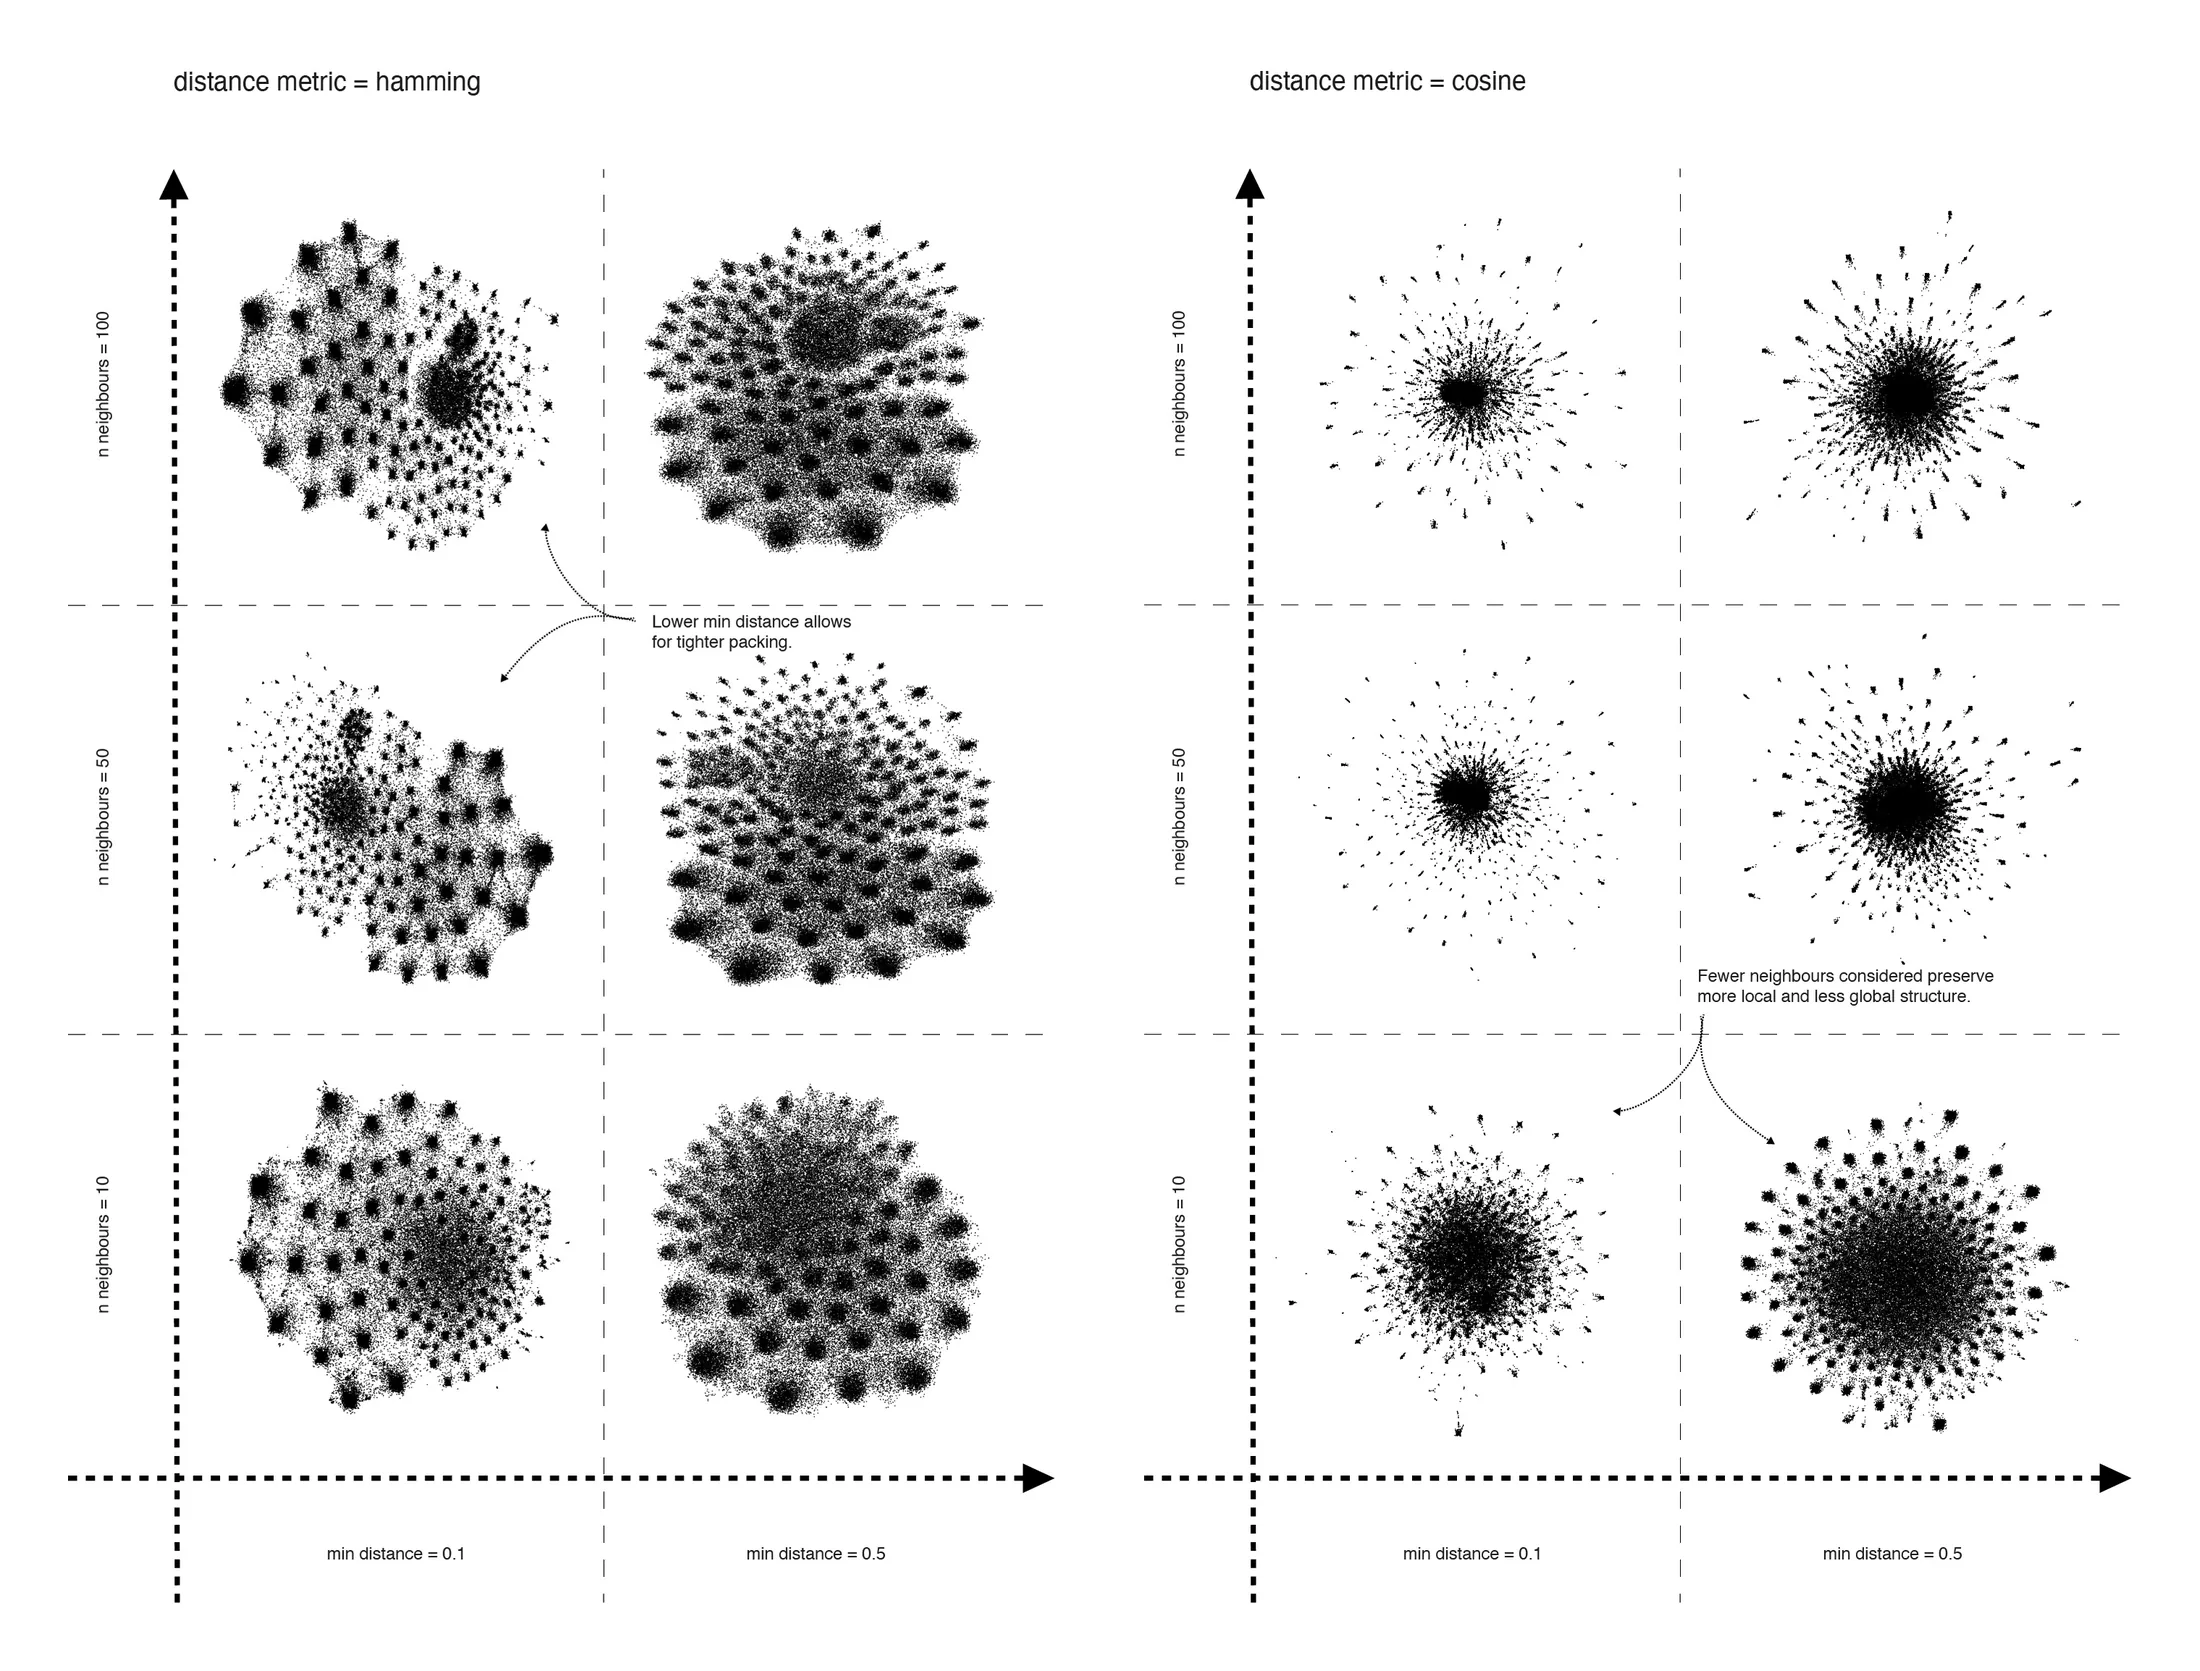
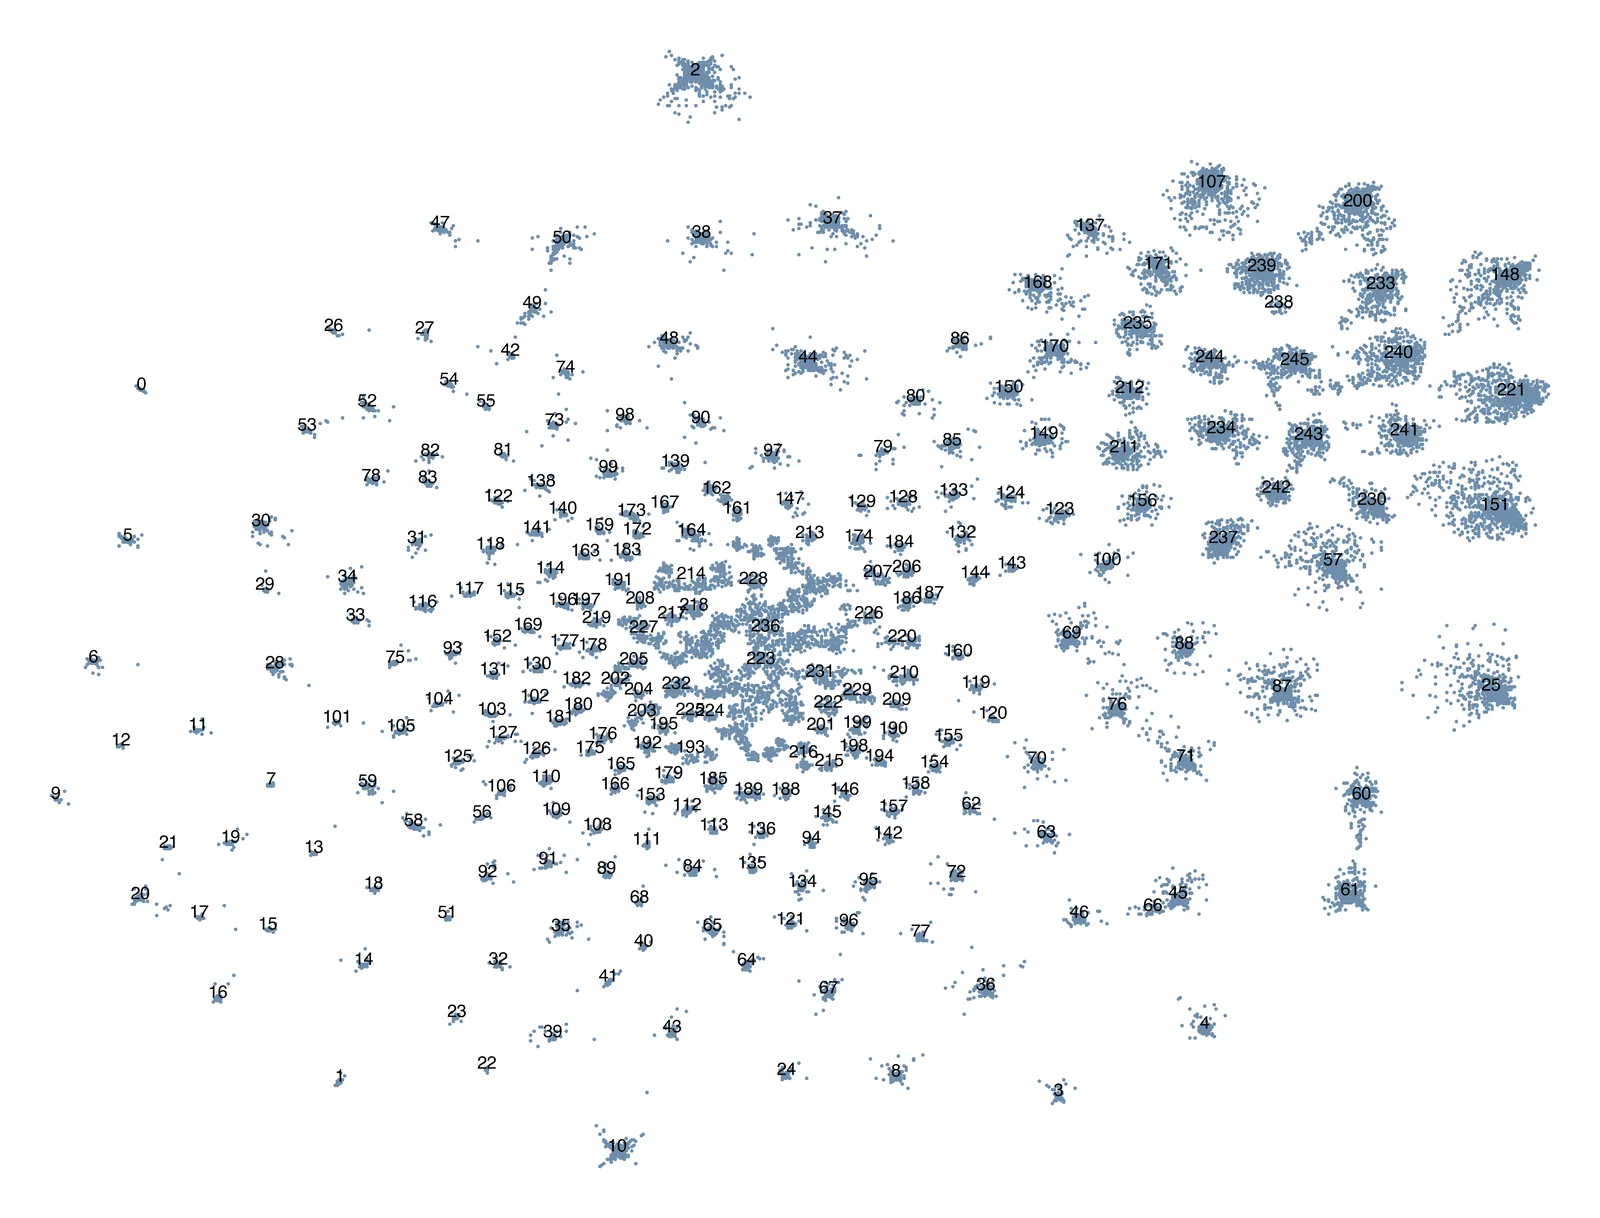
Visual Mapping. Adjusting the hyperparameters of the mapping algorithms is fundamental to understanding the data set. The positions of elements in a dimensionality reduction are affected by several hyperparameters, of which arguably the most important is the measure of distance applied to compute point similarity. The number of neighbours in umap balances how much of the local versus global structure is preserved, which means that setting a small minimum distance between points allows for tighter packing. The experiments on the loan data show how points gravitate to a larger centre and smaller clusters around it (see Figure 1). This relationship between centre and edge remains consistent regardless of which distance metric and other parameters are used. Importantly, umap mappings by no means represent perfectly the original data, and not all distances between the points are necessarily interpretable. If a point were completely disconnected from all the others, umap would fluctuate it randomly and place it somewhere during the layout process. The shortcomings of umap and the caution used when interpreting the results do not necessarily mean that it is not suitable for this research purpose. Since the structure remains robust independently of the parameters, it seems reasonable to choose the mapping with the clearest visual clustering for conducting further analysis. To analyse and interpret the chosen mapping, a clustering algorithm was run on the resulting embedding.
Generation of Subjects and Descriptions
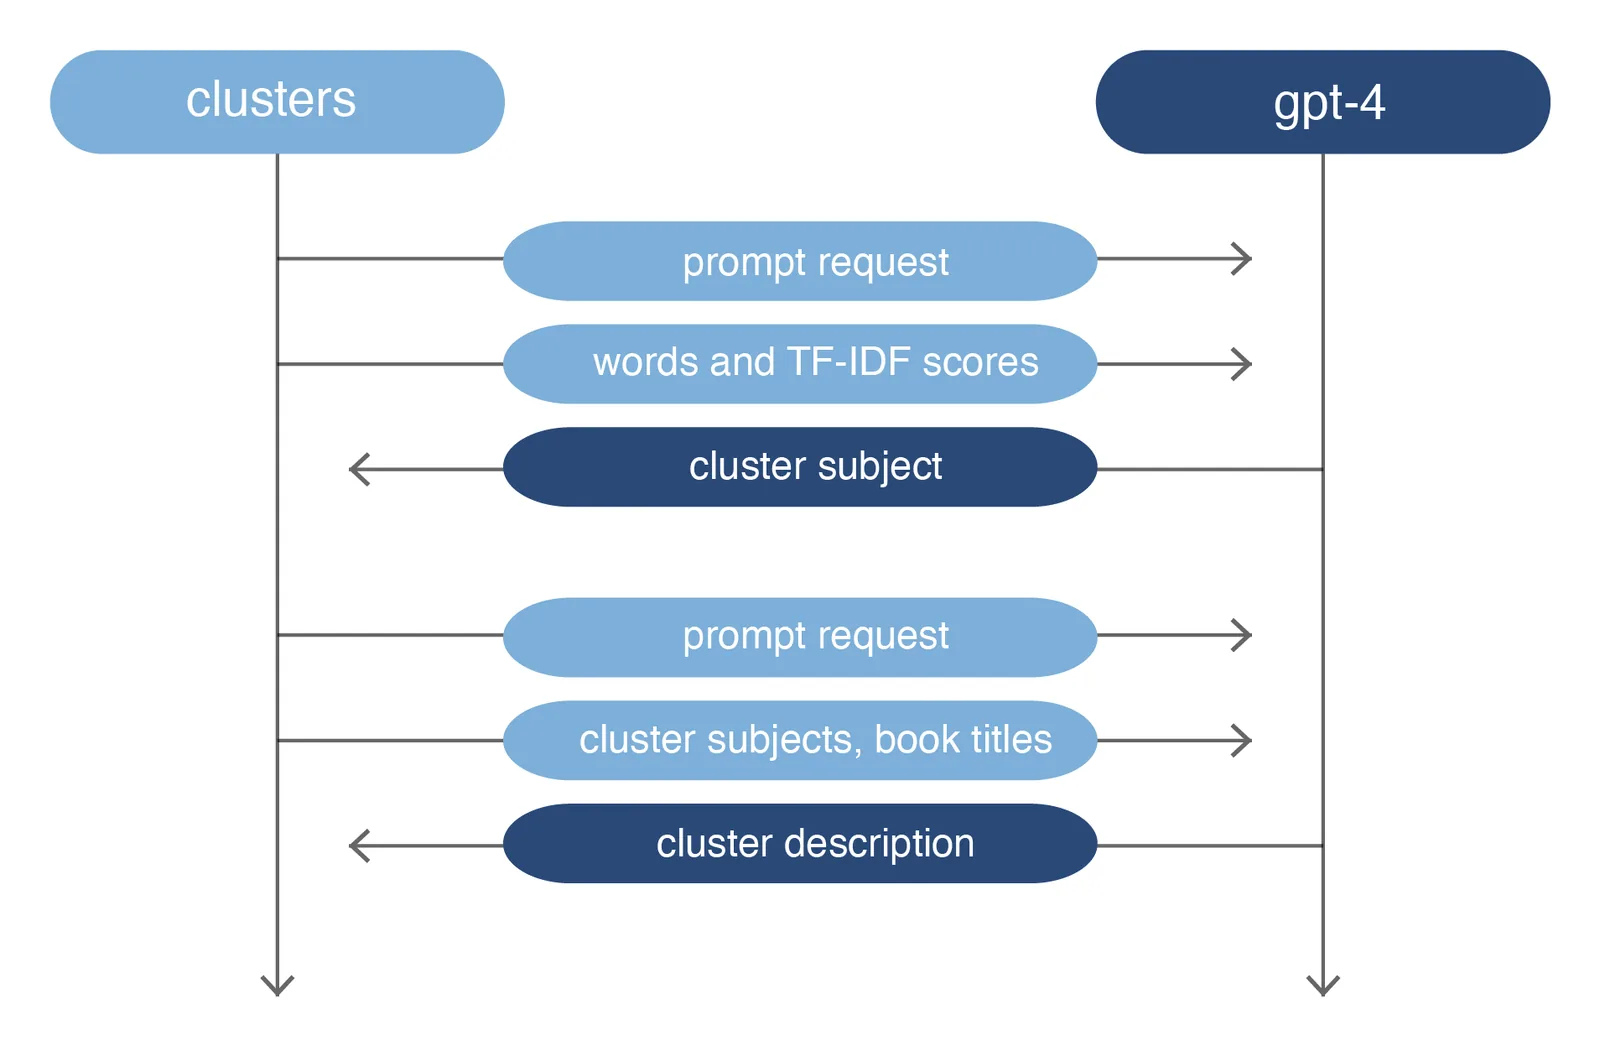
Given the data limitations, especially considering the lack of full texts for semantic analysis, the clusters were described using book titles only. For each cluster, the titles were analysed by word frequency with the aim of generating a subject terminology from textual information (Svenonius 2000, 165). Reflecting on advancements in Large Language Models, OpenAI’s gpt-4 was asked to describe the thousands of books. It was used to label and summarise clusters, thus offering a scalable solution to read the embedding. To address the linguistic diversity, the analysis focused on the most prevalent languages, such as English, German, Italian, Spanish, and French. Book titles were collected by cluster, removing the generic terms using stoplists according to their language (NLTK Project 2023). Before being successively ingested into the gpt-4 model, the resulting strings were weighted through tf-idf to better distinguish the clusters. The word-score lists generated showed a significant variation in size, mainly influenced by the number of books in each cluster. As a result, the number of words was limited to equalise the cluster’s text length and reduce the costs of OpenAI API (OpenAI 2020). Each cluster had a maximum of 100 words per language for a total of 400 words. The most relevant words were retained by discarding lower-scoring words. For each cluster, zero-shot prompts were sent through API to gpt-4 to obtain a subject classification based on a word list with tf-idf scores. Two messages were sent: the first outlined the desired output and format; the second provided the word list organised by language (a single message was causing inaccurate responses). Following the rule of two messages, a second round of queries generated cluster descriptions, enriched by the most borrowed 100 books (see Figure 2). During experimentation, various ways to communicate with the gpt-4 model were tested, evaluating performance. Interestingly, the model was capable of distinguishing the clusters and generating coherent subject classifications, even without contextualising the research into a library of art history.
Limitations
The approach in this paper has limitations related to data quality and handling. Matching loan records to books can cause inaccuracies if the identifiers are not unique; this is evident when the ‘Periodicals’ section experiences inflated loan counts because different editions of the same magazine share the same shelf number. The multilingual nature of the books and their associated metadata also introduces potential bias when querying LLMs, difficult to quantify and affecting result accuracy. Also, the methodology lacks a comparison between the generated classification and the traditional classification system currently in use at Bibliotheca Hertziana. This limits the ability to assess the classification quality brought by the new approach. Lastly, the embedding is heavily influenced by algorithms and their parameters; the choice of algorithms and parameters can significantly impact the final results, introducing variability and potential bias into the outcomes.
Case Study Investigation
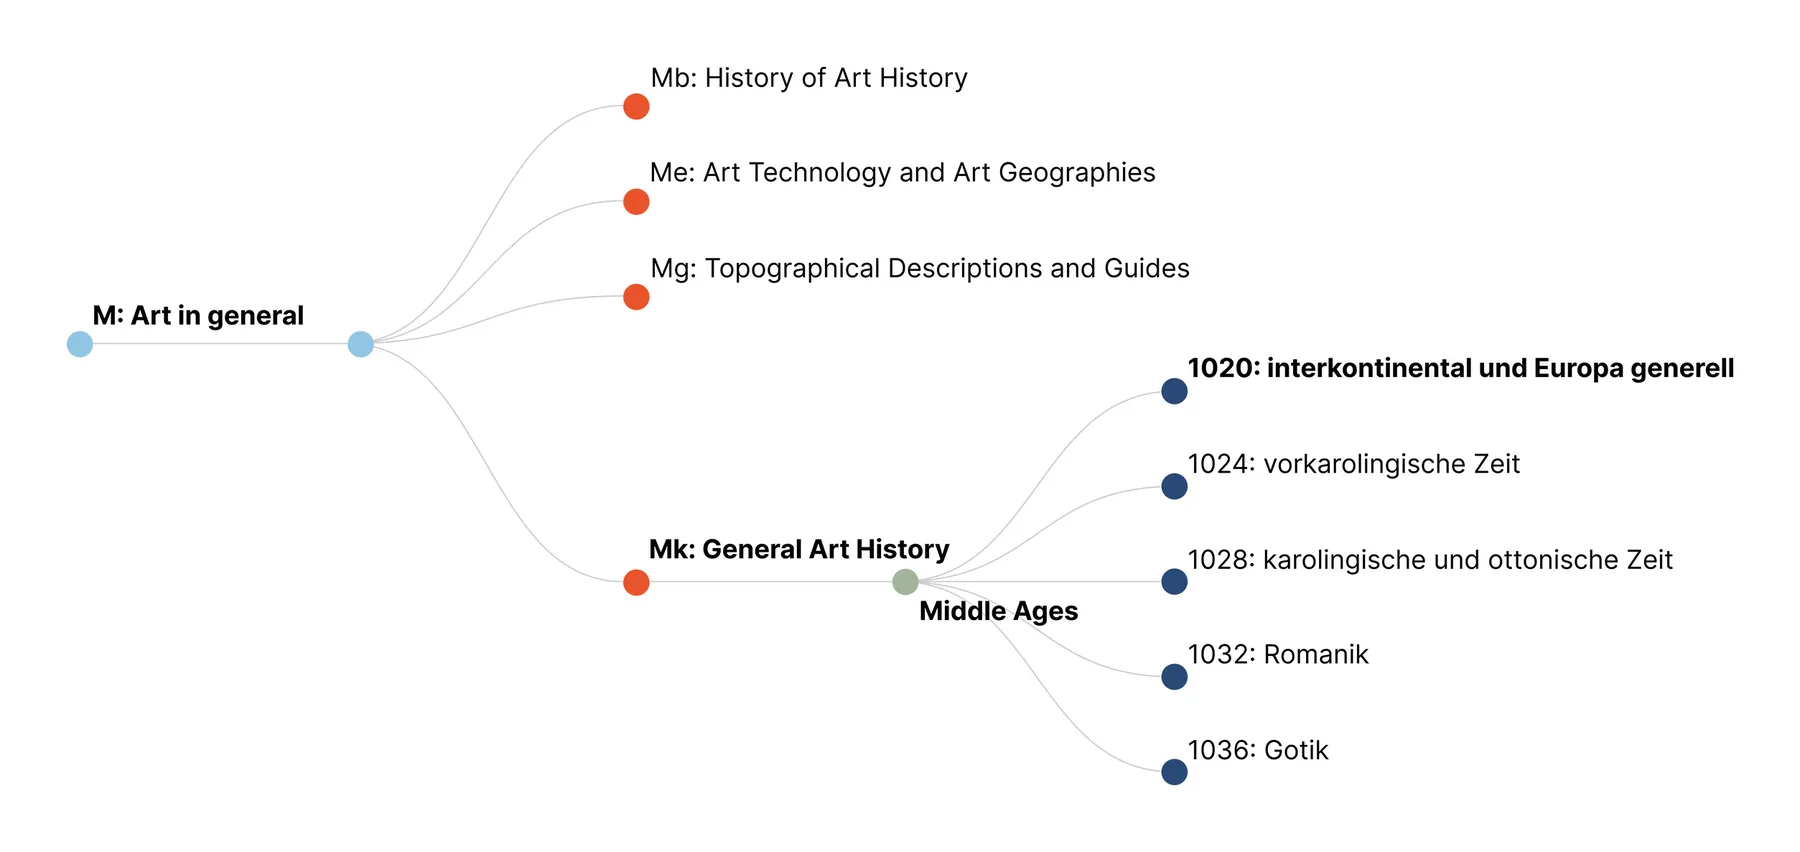
Since the 1960s, Bibliotheca Hertziana has used a shelf numbering system that adheres to the standards of subject languages (Svenonius 2000, 127), determining the possible combinations that place one book next to another (Schnapp and Battles 2014). This system provides valuable insight into the collection, reflecting not only its thematic focus but also its history. It uses a fixed vocabulary of subject-specific terms with several levels, resulting in an in-depth document classification exemplified in Figure 3.
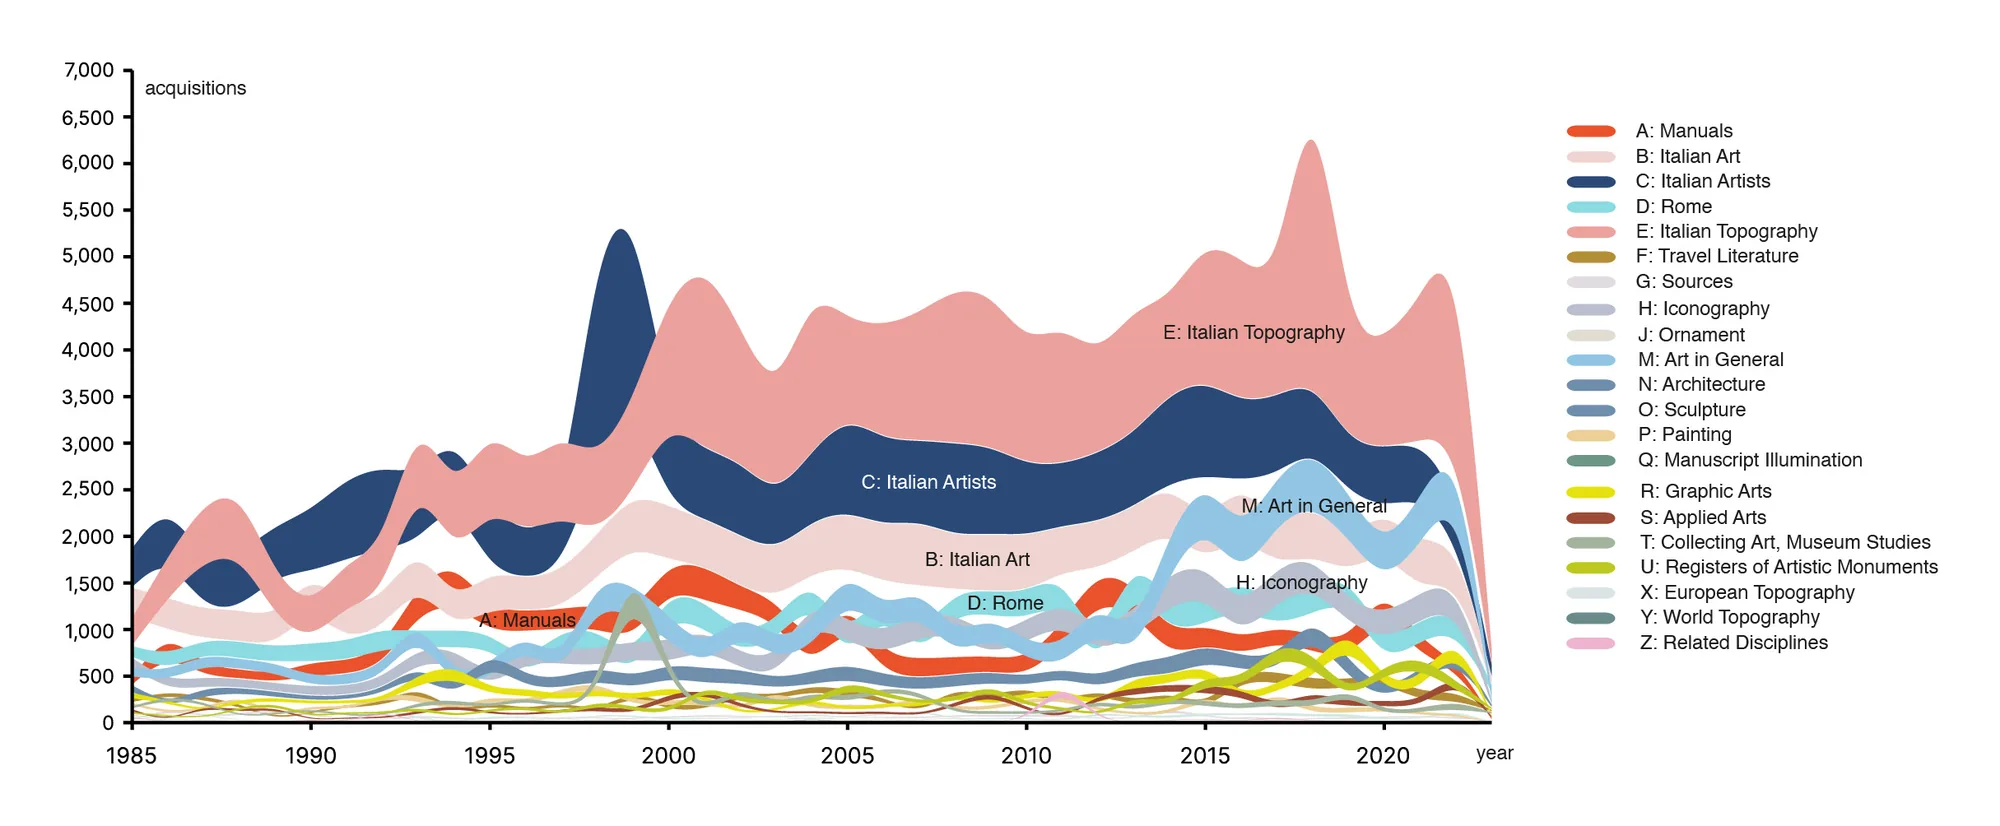
The Hertziana began holding digital records of library acquisitions in 1985. The bump chart in Figure 4 shows the acquisition of books by categories, with the exclusion of periodicals and catalogues for the sake of simplification. The flows’ thickness represents the acquisition number by subjects, offering a diachronic overview of Bibliotheca Hertziana’s collection. This visualisation reflects the moment in which scholars became interested in specific topics, as books are often purchased upon request. Furthermore, the overview clearly shows that the interests of the institute have not changed over the past fifteen years, with the focus still on Italian and Roman art and artists.
However, there are some notable fluctuations that can be observed. There was a peak of book acquisitions in the Italian Artists section at the end of the 1990s, and a later surge in Italian Topography at the end of the 2010s. These changes show different ways to shape the collection: while the former can be attributed to a substantial donation, the peak in Italian Topography coincides with a change of directorship, underlining how the library collection can be shaped by individuals in the interplay between library’s holdings and scholarship.
Beyond the evolution of Bibliotheca Hertziana’s collection, it is interesting to notice how loan activity was meticulously documented and maintained for both internal and external users (see Table 1). This policy was upheld until 2019, when a change restricted the documentation of loans exclusively to researchers internal to the institute. This case study focuses on these internal users because the current loan policy prevents external loans from being documented. However, the available dataset allows retracing the connection between book signatures and the identification numbers of internal users. Most libraries delete personal information after a brief period, so retrieving a decade’s worth of library loan data is highly unusual. Due to legitimate concerns about user confidentiality, loan data are not made public, and user identifiers have been anonymised for this research.
| Loan data | Number of users | Total loans | Number of books |
|---|---|---|---|
| Internal | 638 | 139,542 | 49,289 |
| External | 99 | 324,818 | 77,760 |
Figure 5 shows the results of the computation performed with umap and tf-idf algorithms for applying dimensionality reduction to user loans. The umap algorithm was preferred in this case study, as it outperformed other techniques in terms of computational load and precision. The final choice for hyperparameters is justified by the finest precision in cluster generation (min_dist = 0.1, n_neighbours = 100, metric = Hamming). The hdbscan clustering algorithm (Campello, Moulavi, and Sander 2013) was preferred over other techniques due to its accuracy in identifying clusters of varying sizes. The implementation (McInnes, Healy, and Astels 2017) used for this work assigns probabilities to all points indicating the likelihood of belonging to the cluster (McInnes, Healy, and Astels 2016), providing additional information on how well the clustering is working and helping to detect noise and outliers.
Evaluation Insights
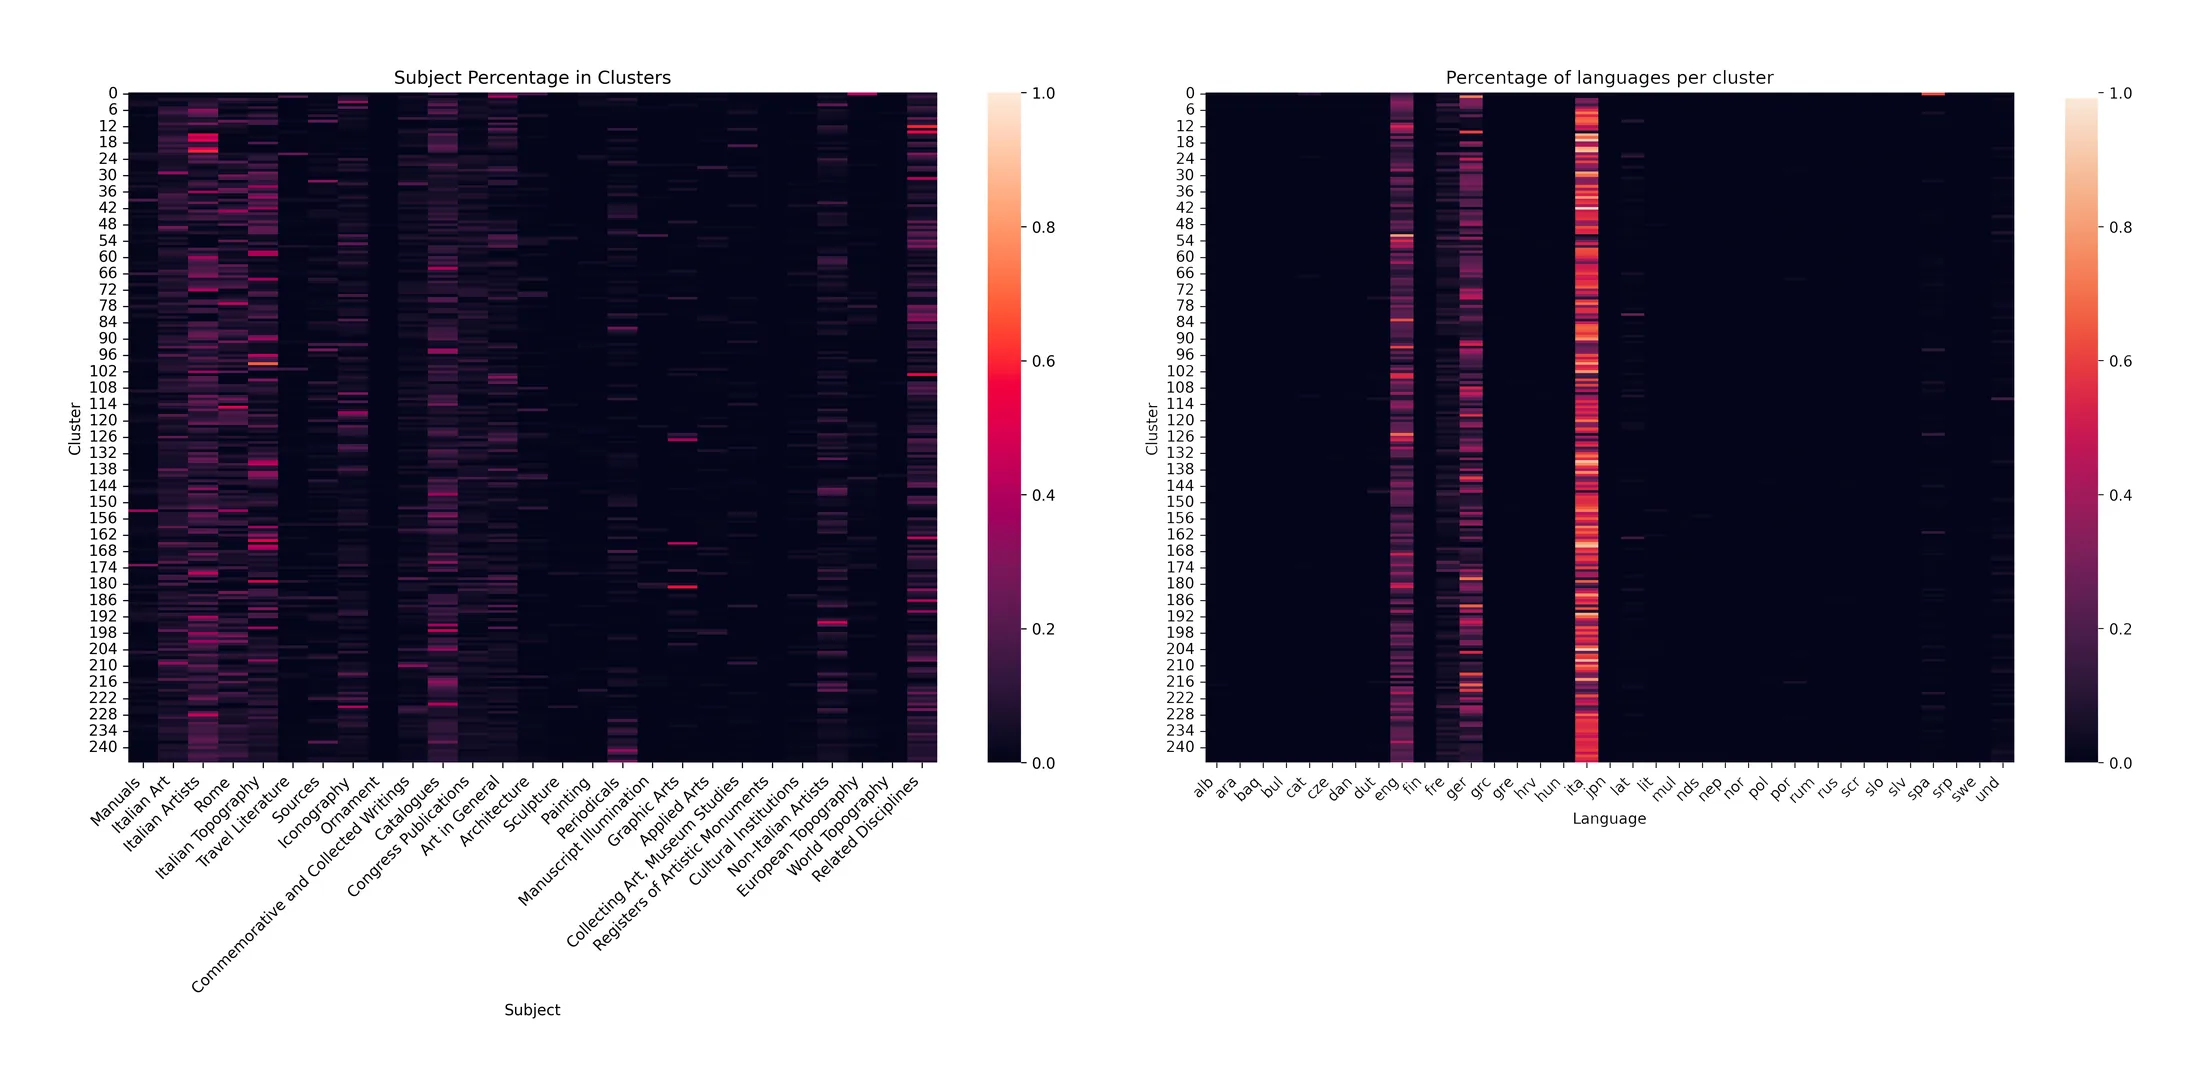
The clustering was assessed by combining the book metadata with loans. By analysing shelf numbers, it can be observed whether users borrow books from the same or different locations, revealing research trends and themes. For example, Figure 6a shows the most active subjects by cluster, while Figure 6b reveals that, while most clusters have a focus on Italian literature, some represent more recent research developments that bring into focus the connection between Italian and South American arts (Bibliotheca Hertziana 2018).
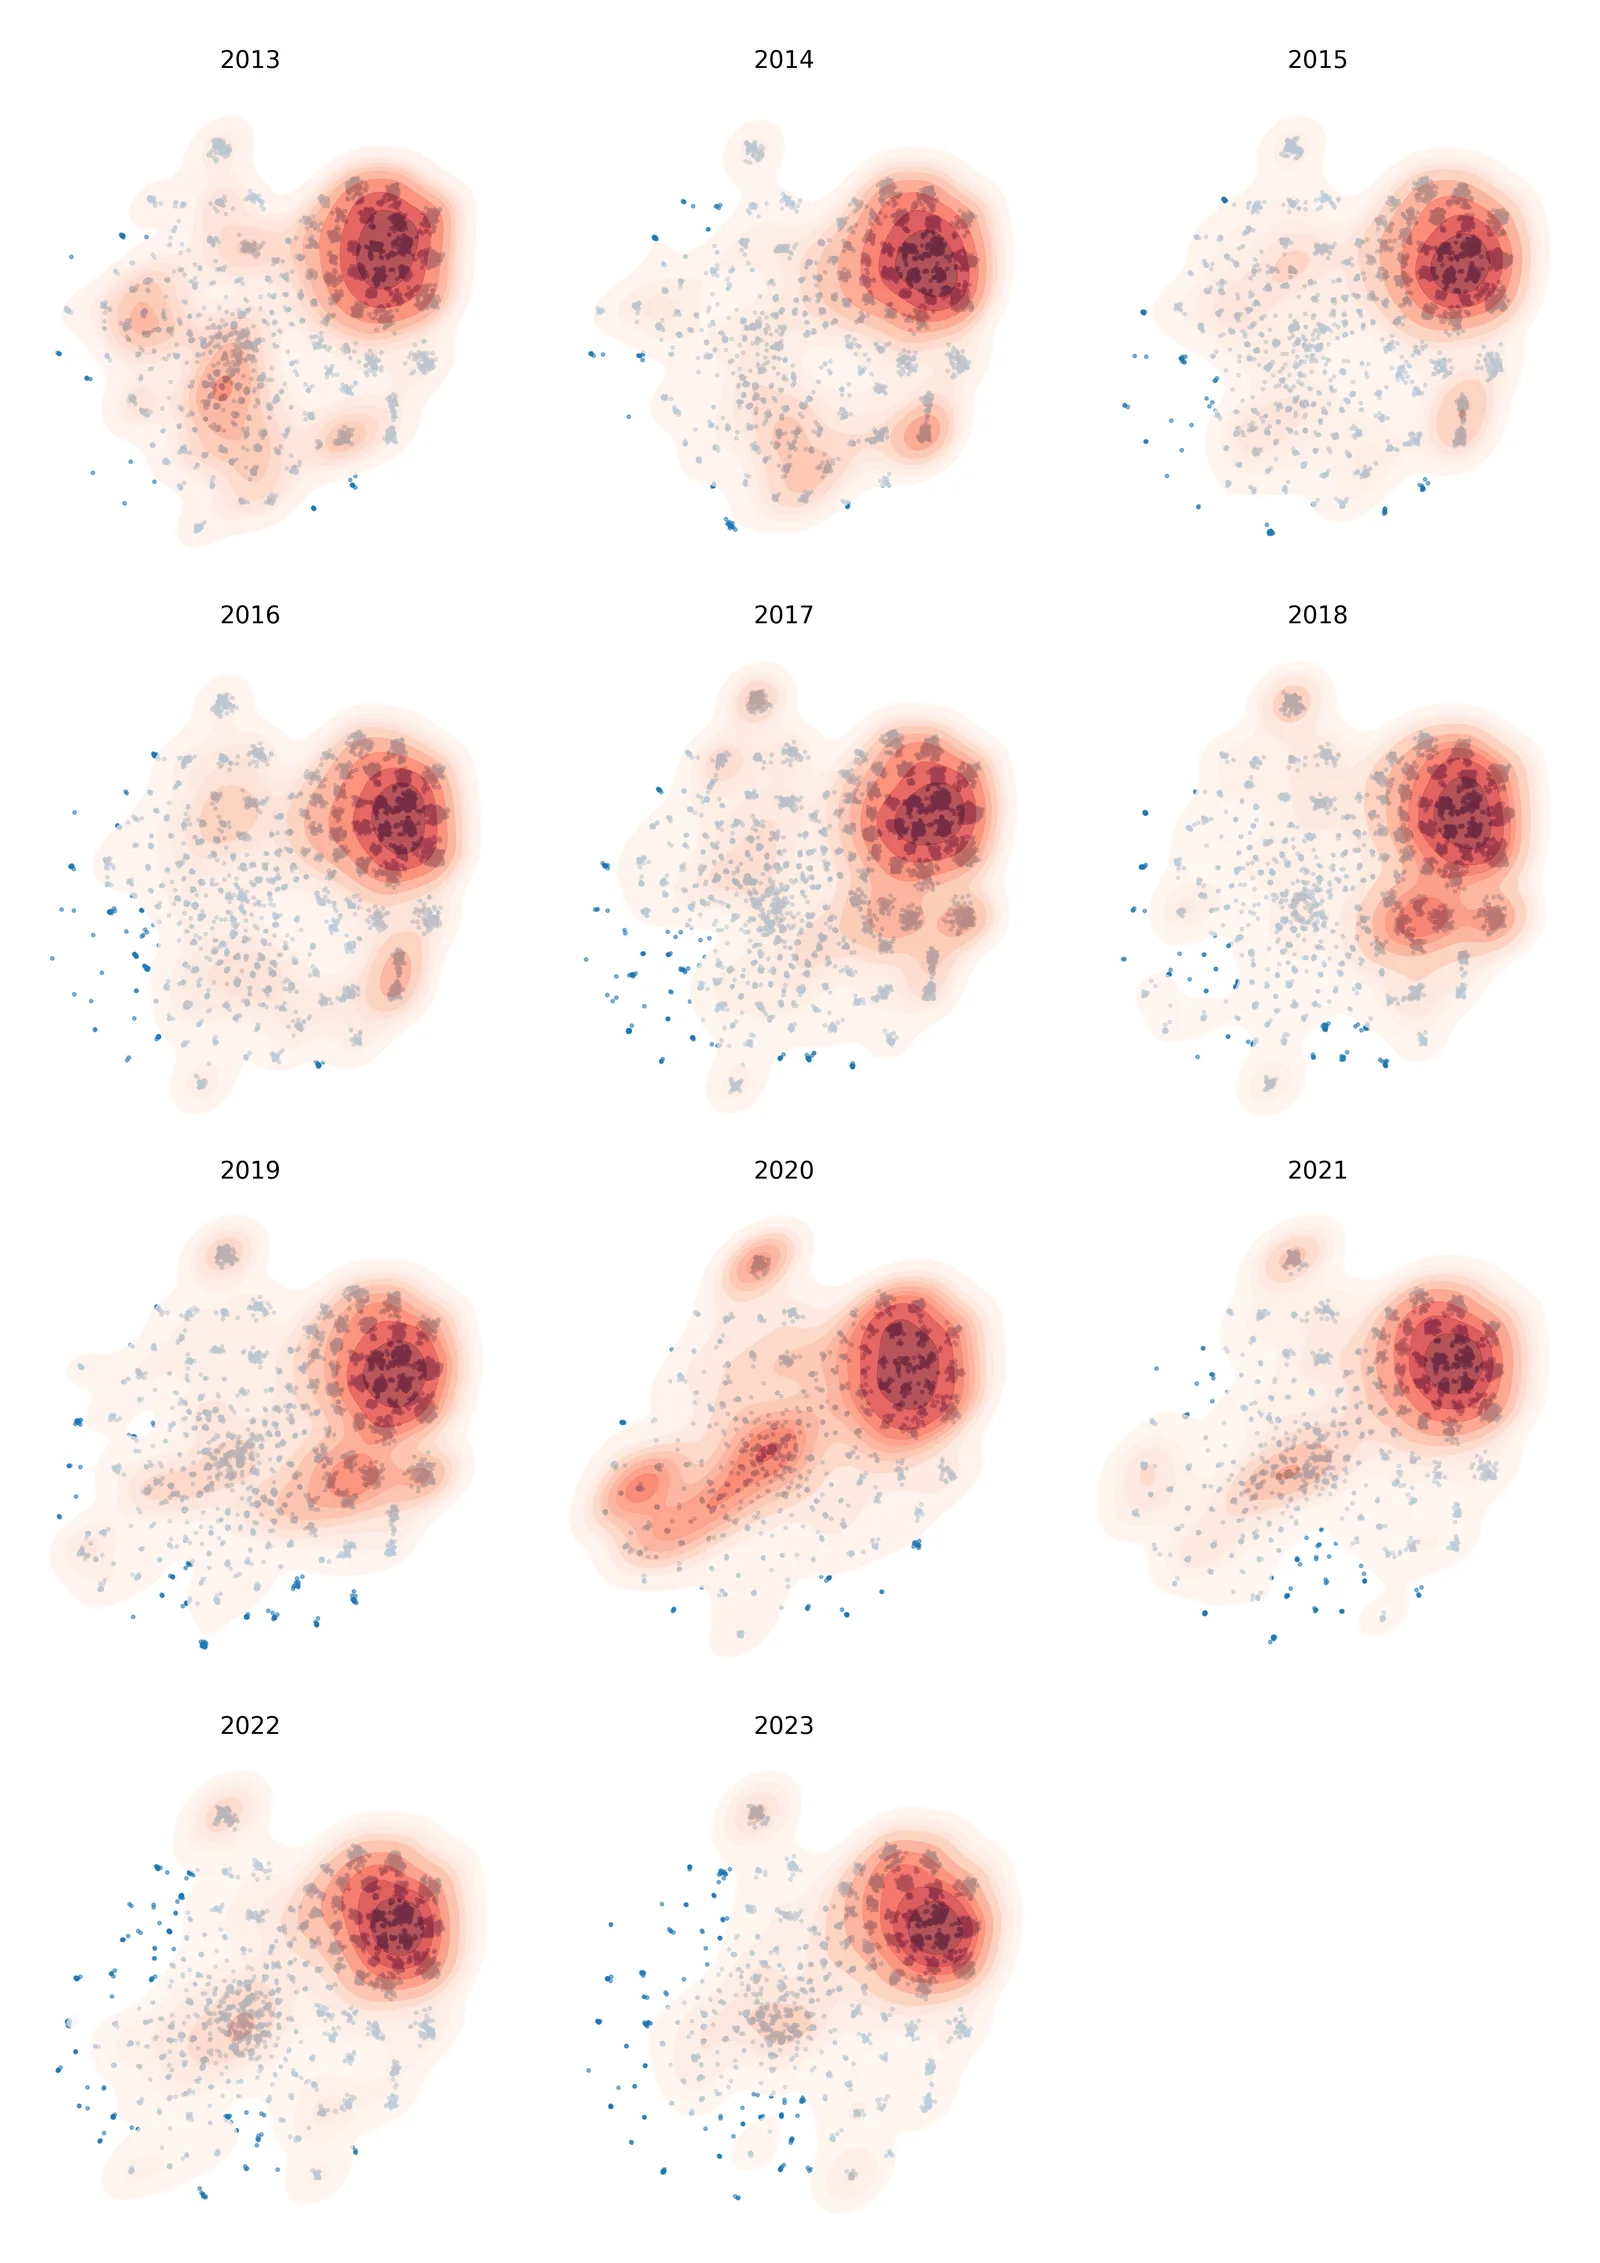
Mapping loans over time and marking high-activity regions can show which clusters and topics were busy at any given point. Figure 7 illustrates the spatial loan density over the years by indicating areas of high activity. The subsequent analyses aim to determine whether these clusters predominantly house the primary corpus of art-history literature. In addition, smaller clusters show shorter bursts of activity, suggesting potential associations with short-term research projects that involve fewer researchers.
Expert Feedback
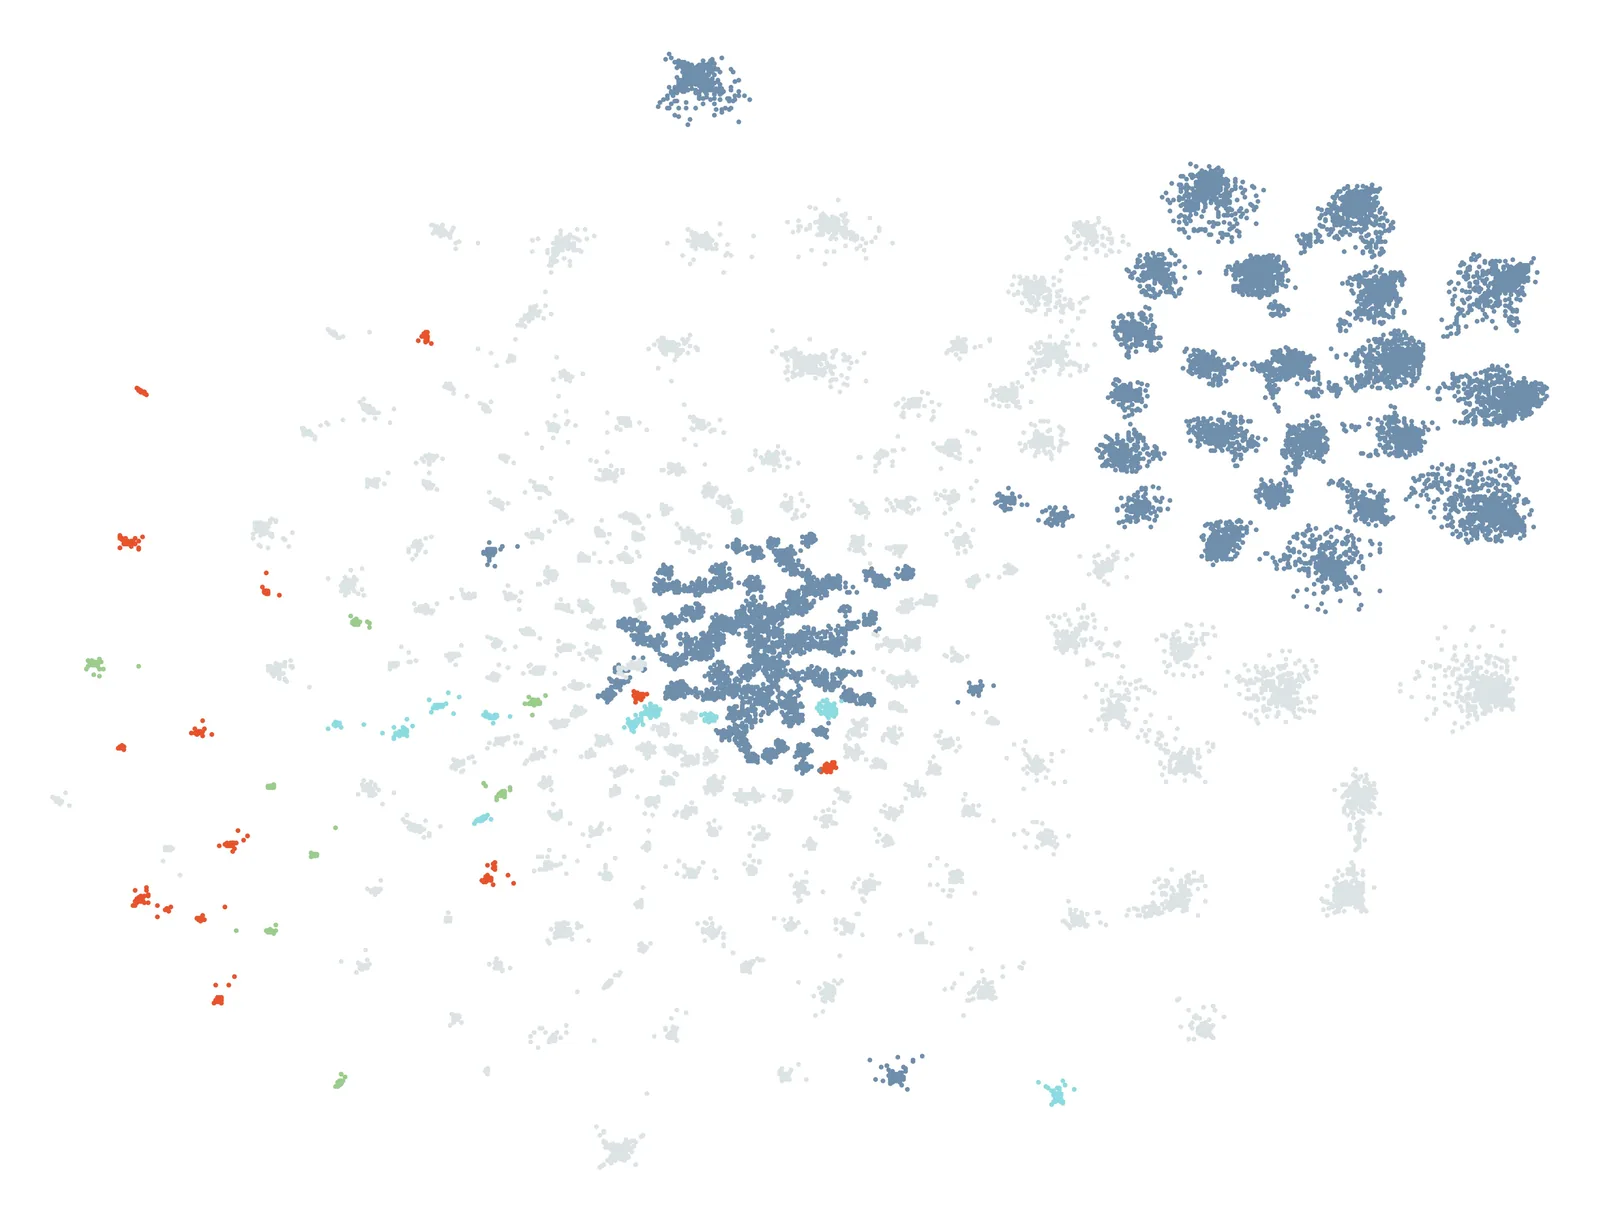
The results of this research were shared with the staff of Bibliotheca Hertziana to determine whether they could recognise their research areas in the final embedding (see Figure 8), through an act of self- and mutual-recognition (Rodighiero and Cellard 2019). This evaluation was facilitated by a specifically designed volume that accurately describes the content of each cluster, titled the Cluster Atlas (Casey 2024). Each cluster is described by its subject classification, a description, and the list of the most borrowed books contained there. In addition, some visuals enhance the visual understanding of the clusters by showing the position within the embedding and the timeline of the books borrowed. The Cluster Atlas was created in Python and exported to html, which was successively converted to PDF format using pdfkit (Stanislav 2021). This workflow was used to automate the volume layout, enabling a progressive design process characterised by multiple iterations. Those iterations allowed for a continuous process of evaluation of the subjects and descriptions generated through the gpt-4 model.
The Hertziana staff were requested to recognise their research or that of their peers. The insights of experienced scholars and long-term employees proved crucial for understanding the findings of this study, allowing also the identification of contributions from temporary fellows that could otherwise go unnoticed. Nine interviews were conducted in person at Bibliotheca Hertziana and at the University of Zurich, with scholars associated with the institute’s departments who were mostly unaware of this study. The interviews’ role was aimed at validating the study conducted with the heads of three departments and their scientific assistants, focussing in particular on the final embedding of the graphical representation.
The interviewees were asked questions about several possible interpretations of the mapping as well as its potential usefulness for their daily practice.2 First, they were asked to identify the research projects they know using a printed version of the Cluster Atlas, which provided interviewees with information on subject classifications, short descriptions, loan periods, word frequencies, and book titles contained in the clusters. This more detailed information complementary to the mapping helped to evaluate whether the institute and their departments were correctly represented. Although interviewees were not specifically asked to locate their projects, as some of them had not been at the institute long enough to be represented in the clusters, many did.
All the participants could immediately link the clusters to specific research upon consulting the Cluster Atlas. Their capacity to recognise clusters depended on their experience: the longer a participant had been at the institute, the further back they could trace projects. One specific interviewee managed to associate most of the projects within the initial 30 clusters with one or two scholars and their respective projects. This person also noticed that some clusters in the lower-left area could easily refer to the borrowing activity of a few scholars. In contrast, the clusters characterised by a wider range of topics, located in the upper right section of the embedding, presented more identification challenges; in fact, these clusters included books borrowed by numerous researchers, making them less attributable to individual projects. This aligns with the borrowing density previously presented in Figure 7, which shows continuous high activity in those areas.
Finally, the participants agreed that the Cluster Atlas accurately reflects the research conducted within the departments, indicating that the mapping of the loan activity reflects the research themes of Bibliotheca Hertziana. Approximately 90% of those interviewed confirmed that the Cluster Atlas and mapping illustrate the evolution of the field, by showing how certain topics have become more prevalent lately. One participant expressed concerns that the subject classification was not grounded in scientific methodology, a fundamental aspect of art historical research; this issue might stem from the absence of methodological details in the textual information at disposal, a situation that can be resolved with full text. Similarly, another participant pointed out that the mapping did not reveal the manner, reasons, and perspectives from which the books were analysed, a goal beyond the capabilities of the computational method.
The interviews not only provided a positive evaluation of the tentative mapping through book loans, but also were useful in assigning clusters to research projects. In the mapping, the interviewees appreciated the idea of developing a recommendation system or a platform to share bibliographies. They also expressed interest in further exploring the mapping through an interactive tool located at the entrance of the library to explore both the collection and current research. From the interviewer’s perspective, they also clearly enjoyed flipping through the Cluster Atlas, searching for completed and ongoing research projects to be associated with their former and present peers. They agreed that descriptions and classifications were too vague to be useful for their research. However, they also agreed that the general classification of subjects is itself too vague and broad to accurately represent the research projects. According to one scholar, for the subject classification to be usable, it should contain more information such as date, geography, and medium.
Conclusion
Using book loans along with minimal textual information and metadata enables the visual organisation of a library collection, leaving interesting opportunities for future research. Instead of relying on the original assumptions of designing a dynamic library’s classification system, this approach more accurately presents itself as a visual tool to identify current research trends and interests.
It is promising that the primary focus of some experts’ critiques is on enhancing the descriptions of clusters by utilising additional data, like abstracts or full texts. Looking ahead, such improvements could be tested, for example, with Hertziana’s critical editions and its rara, a progressively digitised collection of rare and ancient book transcriptions. These books are available for online reading without the need for physical borrowing, necessitating the capture of different forms of user interaction.
Scientists engaged with a scientific library form a clear target group for a recommendation system that not only leverages simple user interactions with books, but also examines the connection of these interactions to the studied fields. In this context, exploring the dynamics among borrowing, referencing, and acquiring books could potentially resolve concerns mentioned by an interviewee about the motivations and viewpoints that influence a scholar’s selection of books. Consequently, this could enhance conventional bibliometric methods by fostering a bottom-up comprehension of the development of specific academic fields.
References
- Bibliotheca Hertziana. 2018. Italy in a Global Context. Available online at: https://www.biblhertz.it/en/dept-weddigen/global-context.
- Bowker, Geoffrey C., and Susan Leigh Star. 2008. Sorting Things Out: Classification and Its Consequences. Inside Technology. Cambridge, MA: MIT Press.
- Boyack, Kevin W., Richard Klavans, and Katy Börner. 2005. “Mapping the backbone of science.” Scientometrics 64 (3): 351–374. doi:10.1007/s11192-005-0255-6.
- Börner, Katy. 2015. Atlas of Knowledge: Anyone Can Map. Cambridge, MA: MIT Press.
- Börner, Katy, Chaomei Chen, and Kevin W. Boyack. 2003. “Visualizing knowledge domains.” Annual Review of Information Science and Technology 37 (1): 179–255. doi:10.1002/aris.1440370106.
- Campello, Ricardo J. G. B., Davoud Moulavi, and Jörg Sander. 2013. “Density-based clustering based on hierarchical density estimates.” In Advances in Knowledge Discovery and Data Mining, edited by Jian Pei, Vincent S. Tseng, Longbing Cao, Hiroshi Motoda, and Guandong Xu, 160–172. Lecture Notes in Computer Science. Berlin, Heidelberg: Springer. doi:10.1007/978-3-642-37456-2_14.
- Casey, Hannah Laureen. 2024. Mapping Bibliotheca Hertziana. Master’s thesis, EPFL. doi:10.5281/zenodo.11056129.
- Chari, Tara, and Lior Pachter. 2023. “The specious art of single-cell genomics.” PLOS Computational Biology 19 (8): e1011288. doi:10.1371/journal.pcbi.1011288.
- Chen, Chaomei. 2017. “Science mapping: a systematic review of the literature.” Journal of Data and Information Science 2 (2): 1–40. doi:10.1515/jdis-2017-0006.
- Glinka, Katrin, Christopher Pietsch, Carsten Dilba, and Marian Dörk. 2016. “Linking structure, texture and context in a visualization of historical drawings by Frederick William IV (1795–1861).” International Journal for Digital Art History (2). doi:10.11588/dah.2016.2.33530.
- Lima, Manuel. 2011. Visual Complexity: Mapping Patterns of Information. New York: Princeton Architectural Press.
- Mauri, Michele, Tommaso Elli, Giorgio Caviglia, Giorgio Uboldi, and Matteo Azzi. 2017. “RAWGraphs: a visualisation platform to create open outputs.” In Proceedings of the 12th Biannual Conference on Italian SIGCHI Chapter, 1–5. Cagliari: ACM. doi:10.1145/3125571.3125585.
- McInnes, Leland, John Healy, and Steve Astels. 2016. How HDBSCAN Works — hdbscan 0.8.1 Documentation. Available online at: https://hdbscan.readthedocs.io/en/latest/how_hdbscan_works.html.
- McInnes, Leland, John Healy, and Steve Astels. 2017. “hdbscan: hierarchical density based clustering.” Journal of Open Source Software 2 (11): 205. doi:10.21105/joss.00205.
- McInnes, Leland, John Healy, and James Melville. 2018. “UMAP: Uniform Manifold Approximation and Projection for Dimension Reduction.” arXiv. doi:10.48550/arXiv.1802.03426.
- NLTK Project. 2023. NLTK: Natural Language Toolkit. Available online at: https://www.nltk.org/.
- Noichl, Maximilian. 2023. “How localized are computational templates? A machine learning approach.” Synthese 201 (3): 107. doi:10.1007/s11229-023-04057-x.
- OpenAI. 2020. OpenAI API. Available online at: https://openai.com/blog/openai-api.
- Petrovich, Eugenio. 2020. “Science mapping.” In Encyclopedia of Knowledge Organization. Available online at: https://www.isko.org/cyclo/science_mapping.
- Picca, Davide, Antonin Schnyder, Eri Kostina, Alessandro Adamou, Dario Rodighiero, and Jeffrey Schnapp. 2023. “Orchestrating Cultural Heritage: Exploring the Automated Analysis and Organization of Charles S. Peirce’s PAP Manuscript.” In Proceedings of the 34th ACM Conference on Hypertext and Social Media, 1–4. Rome: ACM. doi:10.1145/3603163.3609066.
- Pietsch, Christopher. 2020. cpietsch/smb-vis. Available online at: https://github.com/cpietsch/smb-vis.
- RNDR. 2022. Oracle. Available online at: https://rndr.studio/projects/oracle.
- Rodighiero, Dario. 2021. Mapping Affinities: Democratizing Data Visualization. Geneva: Métis Presses.
- Rodighiero, Dario, and Loup Cellard. 2019. “Self-recognition in data visualization: how individuals see themselves in visual representations.” EspacesTemps.net. doi:10.26151/espacestemps.net-wztp-cc46.
- Schmidt, Benjamin M. 2018. “Stable random projection: lightweight, general-purpose dimensionality reduction for digitized libraries.” Journal of Cultural Analytics 3 (1). doi:10.22148/16.025.
- Schnapp, Jeffrey T., and Matthew Battles. 2014. The Library Beyond the Book. metaLABprojects. Cambridge, MA: Harvard University Press.
- Stafford, Barbara Maria. 2012. “Reconceiving the Warburg library as a working museum of the mind.” Common Knowledge 18 (1): 180–187. doi:10/fx8pk4.
- Stanislav, Golovanov. 2021. pdfkit: Wkhtmltopdf Python Wrapper to Convert HTML to PDF Using the Webkit Rendering Engine and Qt.
- Svenonius, Elaine. 2000. The Intellectual Foundation of Information Organization. Digital Libraries and Electronic Publishing. Cambridge, MA: MIT Press.
- The Matplotlib Development Team. 2024. Matplotlib: Visualization with Python. doi:10.5281/zenodo.592536.
- Wilders, Coen. 2017. “Predicting the role of library bookshelves in 2025.” The Journal of Academic Librarianship 43 (5): 384–391. doi:10.1016/j.acalib.2017.06.019.
-
More information about Bibliotheca Hertziana at biblhertz.it. ↩
-
Details of the questionnaire, answers, and code repository can be found in Casey (2024). ↩