Network Literacy: How to Understand, Design, and Read a Visual Relational Model
@article{rodighiero2025network,
  author      = {Dario Rodighiero},
  title       = {Network Literacy: How to Understand, Design, and Read a Visual Relational Model},
  journal     = {Progetto Grafico},
  year        = {2025},
  url         = {https://hdl.handle.net/11370/3648f43f-5e55-48a4-b130-6537029226fc}
}
Models help us navigate the complexity of social life, offering simplified structures that make invisible dynamics legible. Networks stand out for their ability to represent relations directly: nodes and links reduce society to actors and their connections, exposing patterns that often remain hidden in linear accounts. Since the eighteenth century, networks have evolved from mathematical curiosities to essential tools across disciplines. Early sociograms revealed classroom friendships, sociological diagrams exposed social reproduction and inequality, and computational studies now map everything from recipes to scientific collaborations. With their visual grammar, networks invite comparison, clustering, and interpretation across diverse domains. Yet their ubiquity also introduces risks: layouts may be mistaken for objective spaces, central nodes assumed to be more important, and dense graphs admired more for aesthetics than insight. To address these challenges, a new form of literacy is required. Network literacy can be defined as the ability to understand, design, and read visual relational models, combining conceptual knowledge of complex systems with practical skills of visualization and critical interpretation. This paper develops the notion of network literacy as a civic and professional competency, bridging traditions of data literacy and visual literacy. It traces the history of networks from their mathematical and sociological origins to their integration into digital media and design, showing how they reconfigure the codex into a relational mode of reading. It then explores three dimensions: design choices that shape meaning, spatial thinking that guides interpretation, and experimental projects that turn visualization into performative practice. By situating networks at the intersection of information design, critical inquiry, and cultural practice, the paper argues that cultivating network literacy is essential for engaging responsibly with the relational fabric of contemporary knowledge.
Toward Network Literacy
The notion of network literacy arises from the recognition that networks have become one of the most pervasive ways of modeling and visualizing relational complexity in contemporary culture (Lima 2011). To speak of literacy is to frame networks not only as analytical tools but also as cultural artifacts—forms of writing that require both technical competence and interpretive awareness. Just as visual literacy equips readers to decode images and data literacy provides the skills to analyze statistics, network literacy is the ability to understand, design, and read relational models. It involves learning how networks are constructed, recognizing the role of design in shaping their meaning, and developing critical sensibilities for what they reveal and conceal. At its core, network literacy can be defined as the capacity to navigate networks as both designers and interpreters. It is practical, because it demands fluency with the techniques and tools that translate societal dimensions into nodes and links, but it is also cultural, because it acknowledges that networks are not neutral mirrors of reality. They are constructed artifacts that encode decisions, priorities, and assumptions. A network map may chart friendships in a school, citations in a scholarly field, or images in a museum collection, yet in each case the network expresses a worldview: what is considered a node, what counts as a link, and which properties are emphasized. To be literate in networks means being able to decode these decisions, to ask how the model was built, and to interpret its visual conventions with a critical eye.
The notion of network literacy can be better understood if we situate it between data literacy and visual literacy. Catherine D’Ignazio has argued for creative data literacy as a bridge between technical skills and critical reflection, showing how learners must not only acquire the ability to read and analyze data but also use it to question power relations and work toward emancipation (D’Ignazio 2017). Jonathan Gray, Carolin Gerlitz, and Liliana Bounegru have extended this perspective with the idea of data infrastructure literacy, highlighting how infrastructures for producing and circulating data must themselves be interrogated and reimagined (Gray, Gerlitz, and Bounegru 2018). On another plane, Donis A. Dondis framed visual literacy as the universal capacity to compose, interpret, and share meaning through visual forms, a competency as fundamental as verbal literacy (Dondis [1973] 1975). Network literacy stands at the intersection of these two traditions. Like data literacy, it calls for technical and critical awareness of how information is structured; like visual literacy, it emphasizes interpretation, communication, and the social power of images. Yet it is distinct in focusing on the relational model itself: the way nodes and links encode meaning, how design decisions shape interpretation, and how audiences navigate networks as cultural artifacts. In this sense, network literacy extends both literacies, proposing that in an age where knowledge is increasingly organized relationally, we need the skills not only to read data and images, but also to engage with the visual grammars of connection.
The call for literacy becomes urgent when we observe how networks permeate contemporary life. Journalists and artists such as Mark Lombardi have drawn complex diagrams to trace political alliances and financial flows, making visible the hidden ties that shape global power (Hobbs 2004). Museums and archives increasingly adopt network visualizations to reveal the breadth of their collections, moving beyond catalogues to synoptic views that expose unexpected relationships (Windhager et al. 2020). Scientific research too relies on networks, where citation maps and co-authorship graphs communicate relations between papers, authors, and fields, enabling researchers to chart the evolution of knowledge (Noichl 2019). These proliferations demonstrate that networks have moved from specialist instruments to everyday cultural forms. Yet their ubiquity also creates risks. Many viewers read networks as if they were transparent representations, mistaking layout proximity for inherent importance or assuming that central nodes are objectively more influential. Without a literacy that combines technical fluency and critical interpretation, audiences risk being misled by the very tools meant to clarify complexity. Network literacy, in this sense, is an essential civic skill, enabling designers and publics alike to make sense of the increasingly relational fabric of information.
The theme of this journal issue invites us to rethink the codex form. Traditionally, the codex organizes knowledge sequentially, page by page, producing an ordered and linear narrative (Eco 2009). Networks challenge this paradigm. They propose instead a relational codex, where meaning is not found by turning the next page but by following a link, traversing clusters, and exploring proximities. In a network, knowledge is structured spatially and associatively: it is less a path to be walked than a landscape to be navigated. This shift is more than metaphorical. Just as the codex once transformed cultural memory by enabling indexing, cross-referencing, and systematic reading, networks now reconfigure how we encounter information. They allow multiple narratives to unfold simultaneously, depending on where the reader chooses to enter or what connections they follow. In this sense, networks do not abolish the codex but extend it into a form attuned to complexity, multiplicity, and non-linearity. A striking example is Bruno Latour’s AIME Project (Latour 2013), where paragraphs, references, and keywords were woven into digital interfaces that turned a book into a relational environment, foregrounding the interconnected elements of inquiry (Ricci et al. 2017). Cultivating network literacy thus means learning to read this new codex: to treat nodes and links as pages and paragraphs, to interpret clusters as chapters, and to understand that the act of reading is an act of navigation.
Design plays a decisive role in this new literacy. Layout algorithms, color palettes, interactive features—all these elements guide how networks are perceived and interpreted. A force-directed layout may bring similar nodes into visible clusters, while a geographic projection anchors nodes to physical space. Colors may signify communities or categories, while interactivity allows the viewer to filter or zoom. None of these choices are neutral. Each frames the data, emphasizes some patterns, and suppresses others. This is why network literacy requires critical awareness alongside design competence. Designers must acknowledge that visual decisions are epistemic acts: they shape the knowledge that the network communicates. Audiences must learn to ask what assumptions underpin the visualization: why certain data are included or excluded, why centrality appears to be of equal importance, or why a cluster looks more coherent than it really is. A literate approach recognizes that networks can seduce with aesthetic appeal, mislead through algorithmic bias, or oversimplify complex realities. By bringing design and critical interpretation together, network literacy cultivates a double vision: the ability to construct networks responsibly and the ability to question them insightfully. It teaches us to see networks not just as technical diagrams but as rhetorical devices, persuasive in their form as much as in their content.
Building on the historical trajectory traced in History of Networks, this framework sets the stage for the rest of the paper, which explores network literacy in practice. Network Design examines how choices in data preparation, layouts, and tools shape what networks communicate, revealing how meaning is encoded through design. Spatial Thinking turns to interpretation, considering how networks are read as spaces and how conventions such as centrality influence understanding. Surprise Machines offers a case study of experimental visualization, showing how networks can become performative, inviting exploration and critical reflection. Taken together, these sections present network literacy as a constellation of practices—designing, reading, and questioning—that make it possible to navigate complexity. Just as the codex once transformed cultural literacy, networks today call for a literacy of their own, teaching us to read the world not line by line but link by link.
History of Networks
The birth of networks as a model can be traced back to a puzzle of 18th-century Königsberg: was it possible to find a route through the city that crossed each of the seven bridges exactly once without repeating any? When the mathematician Leonhard Euler solved this problem, thinking shifted from physical geography to a new way of seeing connections, establishing what he famously named the “geometry of position” (Sachs, Stiebitz, and Wilson 1988; Euler 1953). His solution showed that what mattered was not the actual distance but how the bridges connected different parts of the city. This discovery laid the groundwork for topology and graph theory, revealing that objects and their relations could form patterns independent of their geographical locations (Shields 2012). In this sense, Euler offered a way to understand structures through their connectivity, moving beyond static maps to dynamic systems of links. His work inspired later thinkers to apply network models to social and cultural questions, from tracing school friendships to exploring power structures. It marked the start of seeing networks as powerful tools for grasping the complexity of the world around us.
If Euler was thinking mathematically, Jacob Moreno was the first to fully recognize the power of networks by giving them their modern visual form. In the 1930s, his diagrams introduced a way to see the hidden structures of social relationships, carefully detailed in Who Shall Survive? (Moreno 1934). Moreno and his collaborator Helen Hall Jennings asked students to name classmates they liked sitting next to. They then mapped these preferences as diagrams, laying the foundation for modern social network analysis (Scott 2000). These sociograms showed how social norms could be visualized, making abstract ties visible and readable. As Moreno himself put it, if we could chart a whole city or nation, we would uncover a vast “solar system of intangible structures” that powerfully influence behavior, just like gravity affects bodies in space (Venturini, Munk, and Jacomy 2019). Moreno argued that until we see these structures, we work blindly to solve social problems. These early sociograms were not yet called “networks,” but they marked the first formal analysis of social relations through diagrams, paving the way for modern network visualization.
A few decades later, Pierre Bourdieu distinguished himself by integrating computational methods into societal studies, moving beyond purely descriptive or qualitative approaches. In Distinction (Bourdieu [1979] 1984), he demonstrated how social reproduction operates through everyday practices of taste, showing that cultural preferences are structured by the distribution of economic, social, and cultural capital. To capture these dynamics empirically, he pioneered the use of correspondence analysis on interview data, enabling the visualization of social layers and the relationships between groups and their lifestyles (Blasius and Schmitz 2014). These diagrams revealed how symbolic boundaries of taste and distinction mapped onto structural inequalities, offering a visual account of stratification that complemented his broader sociological theory. He was also one of the first sociologists to interpret network visualizations, showing how visual forms could expose patterns of imitation and differentiation (Romele and Rodighiero 2020). Building on this legacy, contemporary scholars have argued that network visualization offers epistemic evidence, enabling interpretations of social phenomena that move beyond fixed categories and traditional frameworks (Manovich 2018). These developments highlight how computational networks provide empirical evidence that deepens our understanding of complex social dimensions.
From that moment on, networks developed in parallel with the rise of computational power. Scholars began tackling increasingly large and complex datasets, shifting from small-scale studies to ambitious analyses that demanded advanced computational resources. One influential group of scholars in the Boston area published a manifesto calling for the development of computational social science, setting an agenda that emphasized the integration of massive data, advanced algorithms, and network models (Lazer et al. 2009). Over the years, the physicist Albert-László Barabási, one of the authors of the Boston manifesto, gained significant visibility by popularizing the study of complex networks and making them accessible to a broad audience through his research and publications (Barabási 2002; Barabási et al. 2020). Meanwhile, in Europe, the philosopher Bruno Latour was invited to create a new laboratory at Sciences Po in Paris, the médialab, which combined sociology and computer science, using design as the connecting element between these disciplines (Boullier 2018; Venturini et al. 2017). Latour’s contribution here built on his broader intellectual project: Actor-Network Theory, which redefined society as networks of heterogeneous actants whose relations are constantly negotiated (Latour 2005). As Harman (2009) observes, Latour’s approach was not only methodological but ontological, treating networks as a way to grasp how reality itself is assembled. This orientation gave the médialab its distinctive character, positioning networks as both conceptual and practical tools for exploring social complexity through digital and visual means.
Once networks began circulating in public discourse and media, their visualization became a key mode of interpretation. Design, as Löwgren and Stolterman (2004) argue, makes complex systems legible by highlighting patterns and relations. Manuel Lima (2011) further shows how visual metaphors and aesthetics shape comprehension. What originated in mathematics and sociology now also lives as visual culture, where design plays a central role in how networks are produced and understood.
Network Design
In Visual Complexity, Manuel Lima notes that “an information-visualization designer organizes data to help users see the patterns” (Lima 2011, 12), implying that design choices define what networks communicate. Network design begins with a research question, followed by an empirical synthesis that translates a societal dimension into a relational structure. Designers represent objects as nodes and relationships as links, focusing on the parts of society they want to highlight—this means choosing what to show and what to leave out. Once objects are linked, metrics can define whether those connections carry weights expressing the intensity of relationships—stronger weights lead to stronger attractions in network layouts. Moreno’s sociograms, for example, were created through interviews asking questions like “Whom do you like to sit next to?” (Moreno 1934). While these early diagrams were drawn by hand, today data often take the form of spreadsheets, databases, or JSON files. The transition from manual sociograms to digital mapping, and how it reshapes social research, is explored in Noortje Marres’ Digital Sociology: The Reinvention of Social Research (Marres 2017), which highlights how contemporary means have transformed societal analysis.
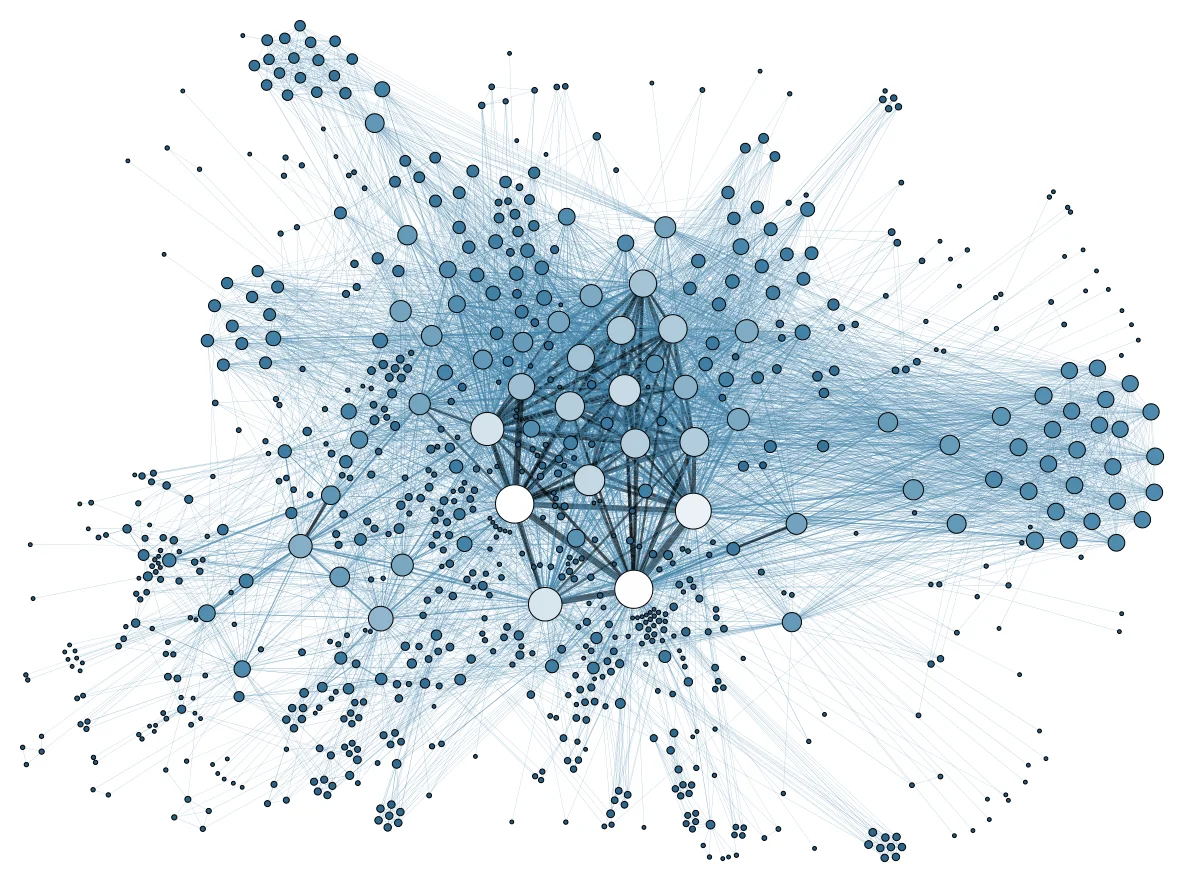
Once data are prepared, the layout becomes the next decisive step in network design. Layouts define the visual arrangement of nodes and edges, shaping the spatial configuration. Force-directed layouts, for example, highlight specific aspects of the data by revealing clusters, hierarchies, or flows (Jacomy et al. 2014). These algorithms are central to network analysis: by processing the attractive forces between nodes, they create spatial arrangements where closer positions indicate stronger relationships, helping viewers identify clusters and connections. As Venturini, Jacomy, and Jensen (2021) emphasize, layouts introduce an inherent ambiguity: they do not map an objective space but construct one where relationships become visible through the logic of design. Yet this ambiguity is not a limitation but a feature, offering a subjective perspective to explore complex social structures visually. By embracing this subjectivity, thoughtful layout design reveals hidden patterns, clarifies complexity, and makes networks more engaging—far from being a neutral technical step, it becomes a fundamental design decision guiding how audiences interpret the data.
Layouts are often generated through programming, but to make network literacy more accessible, there are digital tools that do not require coding skills. Software like Gephi offers a friendly environment for manipulating network data, combining interactive exploration with customizable views (Bastian, Heymann, and Jacomy 2009). Gephi allows users to import external data and apply a layout by adjusting its parameters in real time, helping designers make network configurations more legible. It also offers intuitive tools to refine appearance, allowing users to adjust details like node spacing, edge opacity, and label styles for clearer and more compelling visualizations (Grandjean 2015). Fine-tuning elements such as preventing node overlap, adding curved edges, and choosing effective color palettes transforms dense graphs into more readable and engaging network maps. These digital tools not only improve clarity but also support a deeper understanding of network dynamics by allowing designers to iteratively adjust how data are presented. By combining analytical metrics with interactive visualization, tools like Gephi turn networks from static diagrams into exploratory interfaces that guide users through complex relational data.
When it comes to publishing, web frameworks like D3.js open new possibilities for creating engaging network visualizations. The D3.js library in particular enables designers to build customized visuals for the browser, binding data to document elements and rendering them dynamically (Bostock, Ogievetsky, and Heer 2011). By supporting scalable vector graphics and integrating seamlessly with JavaScript, HTML, and CSS, the library allows designers to tailor every aspect of a visualization for web environments, optimizing readability and interactivity. Michael Bostock, who introduced information design at The New York Times, created D3.js to give designers more control over web-based visualizations and later developed Observable, a platform for building and sharing interactive notebooks (Bostock 2017). Observable’s reactive programming environment automatically updates visuals as data or code change, making it easier to experiment, communicate insights, and create dynamic explanations. Together, D3.js and Observable can transform complex networks into accessible and engaging web experiences, enabling designers to turn intricate relational data into clear, explorable stories across devices and browsers.
In a more technical arena, dimensionality reduction techniques like t-SNE (van der Maaten and Hinton 2008) and UMAP (McInnes, Healy, and Melville 2018) enable designers to simplify high-dimensional data into readable, lower-dimensional layouts that reveal hidden patterns. By projecting complex datasets into two or three dimensions, these methods make it possible to visualize similarities and groupings among data points that would otherwise remain obscured in high-dimensional space. t-SNE excels at preserving local relationships, capturing subtle clusters in data, while UMAP balances local detail with a better representation of global structures, offering faster performance on large datasets. These algorithms help designers visualize much larger datasets, ensuring that visualizations remain faithful to key relationships. By connecting advanced data analysis with effective visual communication, dimensionality-reduction techniques make it possible to uncover insights in collections of data far larger than those manageable by traditional network layouts (Rodighiero, Wandl-Vogt, and Carsenat 2022; Rodighiero et al. 2022; Rodighiero and Daniélou 2023; Rodighiero, Rivière, and Kenderdine 2024).
As these design choices and methods show, every step in network visualization leads naturally to considering how space shapes meaning. Spatial arrangements guide how viewers interpret network structures, turning tabular data into visual patterns. Understanding networks as designed spaces prepares us to explore how spatial thinking influences perception, revealing not just what networks contain but how they communicate insights through their spatial organization.
Spatial Thinking
In addition to design, reading networks is the other key aspect of network literacy: it involves developing spatial thinking to understand how networks present information. As highlighted in recent cartographic theory, recognizing the interplay of topography and topology helps reveal how network maps construct spaces that resonate with contemporary spatialities—spaces defined more by relational patterns that shape meaning in the social world (Lévy, Maitre, and Romany 2016). Revisiting Euler’s Königsberg bridges through the lens of cultural topology shows that networks are not just logical structures but dynamic spaces where relationships, historical contexts, and social forces intertwine, demonstrating how spatial arrangements can carry cultural meaning and reflect shifting power and identities (Shields 2012).
Beyond theoretical perspectives, mathematical metrics provide essential tools for reading and interpreting networks, including density, degree, and modularity (Grandjean 2021). Density measures how many connections exist relative to the maximum possible, giving a sense of how tightly knit a network is. Degree, the simplest centrality measure, shows how many connections each node has, highlighting the most locally active or connected elements. Modularity detects communities by identifying regions of the network where nodes are more densely linked to each other than to the rest of the graph, uncovering clusters that may correspond to visual interpretation. Together, these metrics transform complex visual patterns into quantifiable insights, enriching understanding and supporting nuanced interpretations.
Centrality is a particularly influential spatial convention in network visualization, shaping how viewers perceive importance or influence. According to Grandjean (2021), centrality metrics such as degree, closeness, and betweenness each capture different aspects of a node’s role in the network—whether it is the most connected, the quickest to reach others, or the best positioned to bridge separate groups. Yet when nodes appear near the center of a visualization, they are often read as more important, even if their placement stems from algorithmic layouts rather than objective hierarchies. In the Affinity Map, for example, individuals displayed at the center felt more valued, as if centrality signaled prominence, even though the map reflected affinities rather than formal status (Rodighiero 2021). This shows how centrality in network maps may be interpretative, influencing how people see themselves and others within a network.
Interactivity further enhances readability, turning static visuals into dynamic tools for exploration. As Grandjean (2021) emphasizes, interactive functions such as selecting nodes, filtering edges, and zooming into dense areas allow users to manipulate the network directly, uncovering structures or relationships that might remain hidden in a static layout. This hands-on engagement supports active learning, echoing Piaget’s idea that understanding emerges through three-dimensional manipulation. By enabling viewers to adjust perspectives or highlight specific features, interactive network visualizations foster deeper, more personal comprehension of complex data, transforming networks into spaces for inquiry and discovery rather than passive observation.
Reading networks spatially is much like reading a city map: just as a street map helps us navigate neighborhoods or landmarks, spatial thinking in networks allows us to explore paths, proximities, and boundaries among nodes. As Latour (2013) argues, networks do not simply represent relationships; they create spaces of interpretation where meaning emerges through connections and distances. By zooming into clusters, we can see why certain nodes are close; by zooming out, we can ask why clusters appear together or apart—each perspective offering a different narrative. This reading is inherently subjective: though general patterns may be shared, each exploration reflects individual questions, interests, and timing. Such personal, performative engagement makes reading a network an interpretative act, but it also brings biases—our motivations shape what we see and how we understand the network’s spatial story.
To illustrate these ideas in practice, the next case study, Surprise Machines, explores how experimental network visualizations engage spatial thinking and challenge our expectations.
Surprise Machines
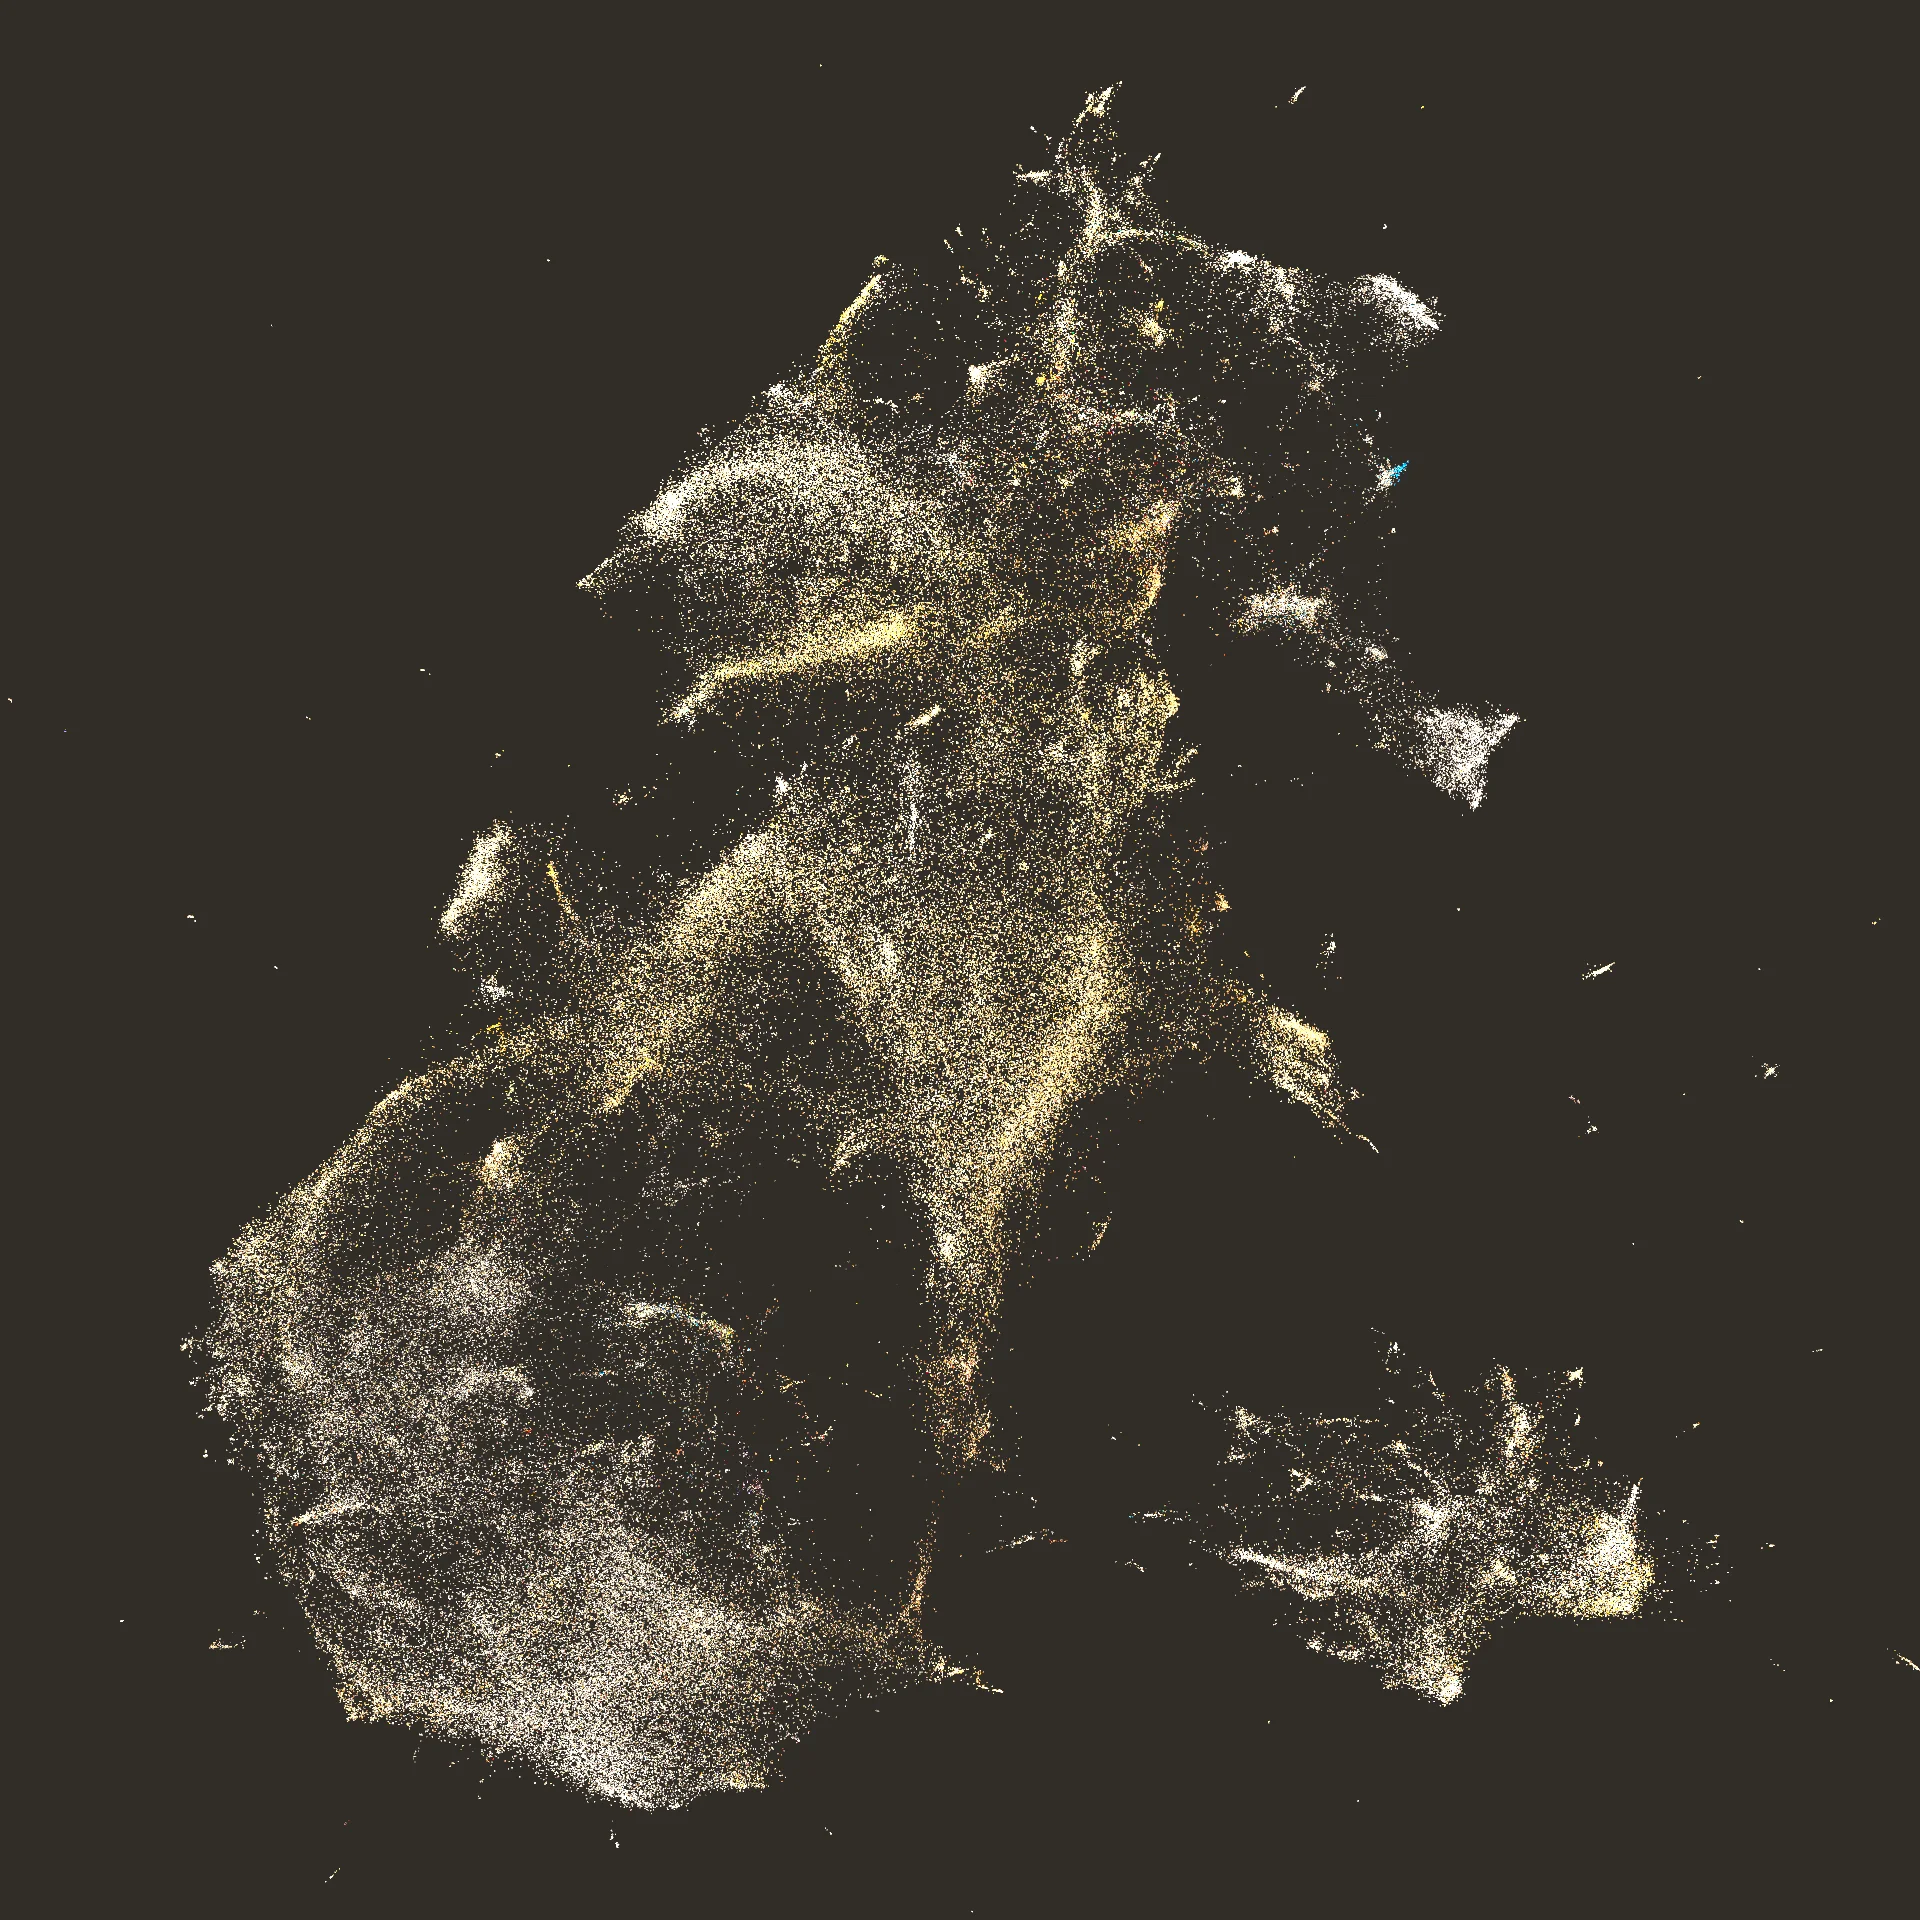
Surprise Machines (Rodighiero et al. 2022) is a critical visualization project developed for the Curatorial A(i)gents exhibition at the Harvard Art Museums, designed to reimagine how visitors engage with large digital collections. It addresses the aesthetics of networks by transforming over 200,000 images into a dynamic visual interface that reveals the often-invisible scale of the museum’s archives. Rather than simply presenting data, the project turns network visualization into a performative, immersive experience, encouraging visitors to question what it means to see and understand a collection in its entirety. By mapping images into a two-dimensional space based on visual similarity, Surprise Machines blends aesthetic choices with data-driven algorithms, creating an interface that is both scientifically rigorous and artistically evocative. This hybrid approach situates the project at the intersection of design, technology, and museology, expanding what network aesthetics can mean beyond static graphs toward interactive, embodied, and surprising encounters with cultural data.
The conceptual foundation of Surprise Machines is to challenge traditional expectations of museum displays by using networks to generate ever-changing visual landscapes. Inspired by Alan Turing’s notion of machines producing surprise, the project embraces unpredictability as a core design principle. Instead of fixed exhibitions curated by humans, it offers dynamic arrangements where visitors navigate clusters of related images, encouraging exploration and serendipitous discovery. By organizing images through dimensionality-reduction algorithms like UMAP (McInnes, Healy, and Melville 2018), the system generates patterns that defy linear storytelling, shifting focus from individual artworks to relationships across the collection. This challenges the conventional view of museums as static repositories of knowledge and instead proposes them as fluid spaces for personal interpretation. By intentionally embracing ambiguity and surprise, the project invites viewers to reflect on how both algorithms and human choices shape what is seen, offering a new paradigm for museum engagement rooted in networked thinking.
At its core, Surprise Machines relies on a sophisticated technical process that combines layout algorithms with deliberate visual rules to create emergent patterns. Using tools like PixPlot (Duhaime [2017] 2021), the project maps images according to visual similarity, producing a network-like nebula where clusters form organically. This computational approach departs from conventional force-directed layouts by embedding images in a space defined by their aesthetic features, allowing unexpected formations to emerge. Visual rules further guide the experience: image previews are spaced to prevent overlap, clusters maintain coherence, and zooming transitions are smoothed to enhance exploration. These rules ensure that while the layout is algorithmically determined, it remains navigable and engaging. As a result, surprising relationships appear within the collection—such as unforeseen groupings of portraits or materials—transforming the dataset into a rich visual landscape that resists linear interpretation.
The project foregrounds the viewer’s interpretative agency, positioning exploration as a core element of network literacy. Unlike traditional visualizations that prescribe a narrative, it invites visitors to perform their own readings, deciding where to zoom, which clusters to investigate, and which patterns to pursue. This participatory model aligns with the idea that visual literacy involves not only recognizing patterns but also critically questioning the processes and choices behind what is made visible. By making navigation itself a form of meaning-making, Surprise Machines empowers viewers to construct personal interpretations, acknowledging that each act of seeing is shaped by individual curiosity, background, and context. This approach democratizes access to complex collections, encouraging deeper engagement and reflective encounters with both data and design. In doing so, it challenges passive consumption of information and advocates for an active, questioning stance at the heart of visual literacy.
Finally, Surprise Machines brings together spatial and design decisions in a way that highlights the playful, performative dimension of network literacy. By choreographing visitors’ gestures to interact with the visualization—through a choreographic interface—the project merges physical exploration with digital navigation. This spatial engagement transforms reading a network into a kind of dance, where each movement reshapes the visual field and opens new interpretations. The design choices, from clustering algorithms to interactive transitions, encourage experimentation and surprise, underscoring that networks are not static maps but evolving spaces that respond to viewers’ actions. This performative aspect embodies the core of network literacy: understanding that meaning in networks arises not only from data and design but also from how users move through, manipulate, and interpret these complex structures. Surprise Machines thus stands as a testament to how thoughtful spatial and interactive design can transform network visualizations into immersive, interpretative experiences.
Conclusion
This text has explored three key dimensions of network literacy: design, spatial thinking, and critical interpretation. Design shows how choices in data preparation, layout, and visual conventions shape what networks communicate. Spatial thinking highlights how networks function as spatial imaginaries, revealing patterns, clusters, and relations that might otherwise remain hidden. Critical interpretation underscores the designer’s role in guiding how audiences navigate these structures, reminding us that every decision frames what becomes visible. Taken together, these perspectives define network literacy as a transversal skill that spans visual communication, digital humanities, and data journalism.
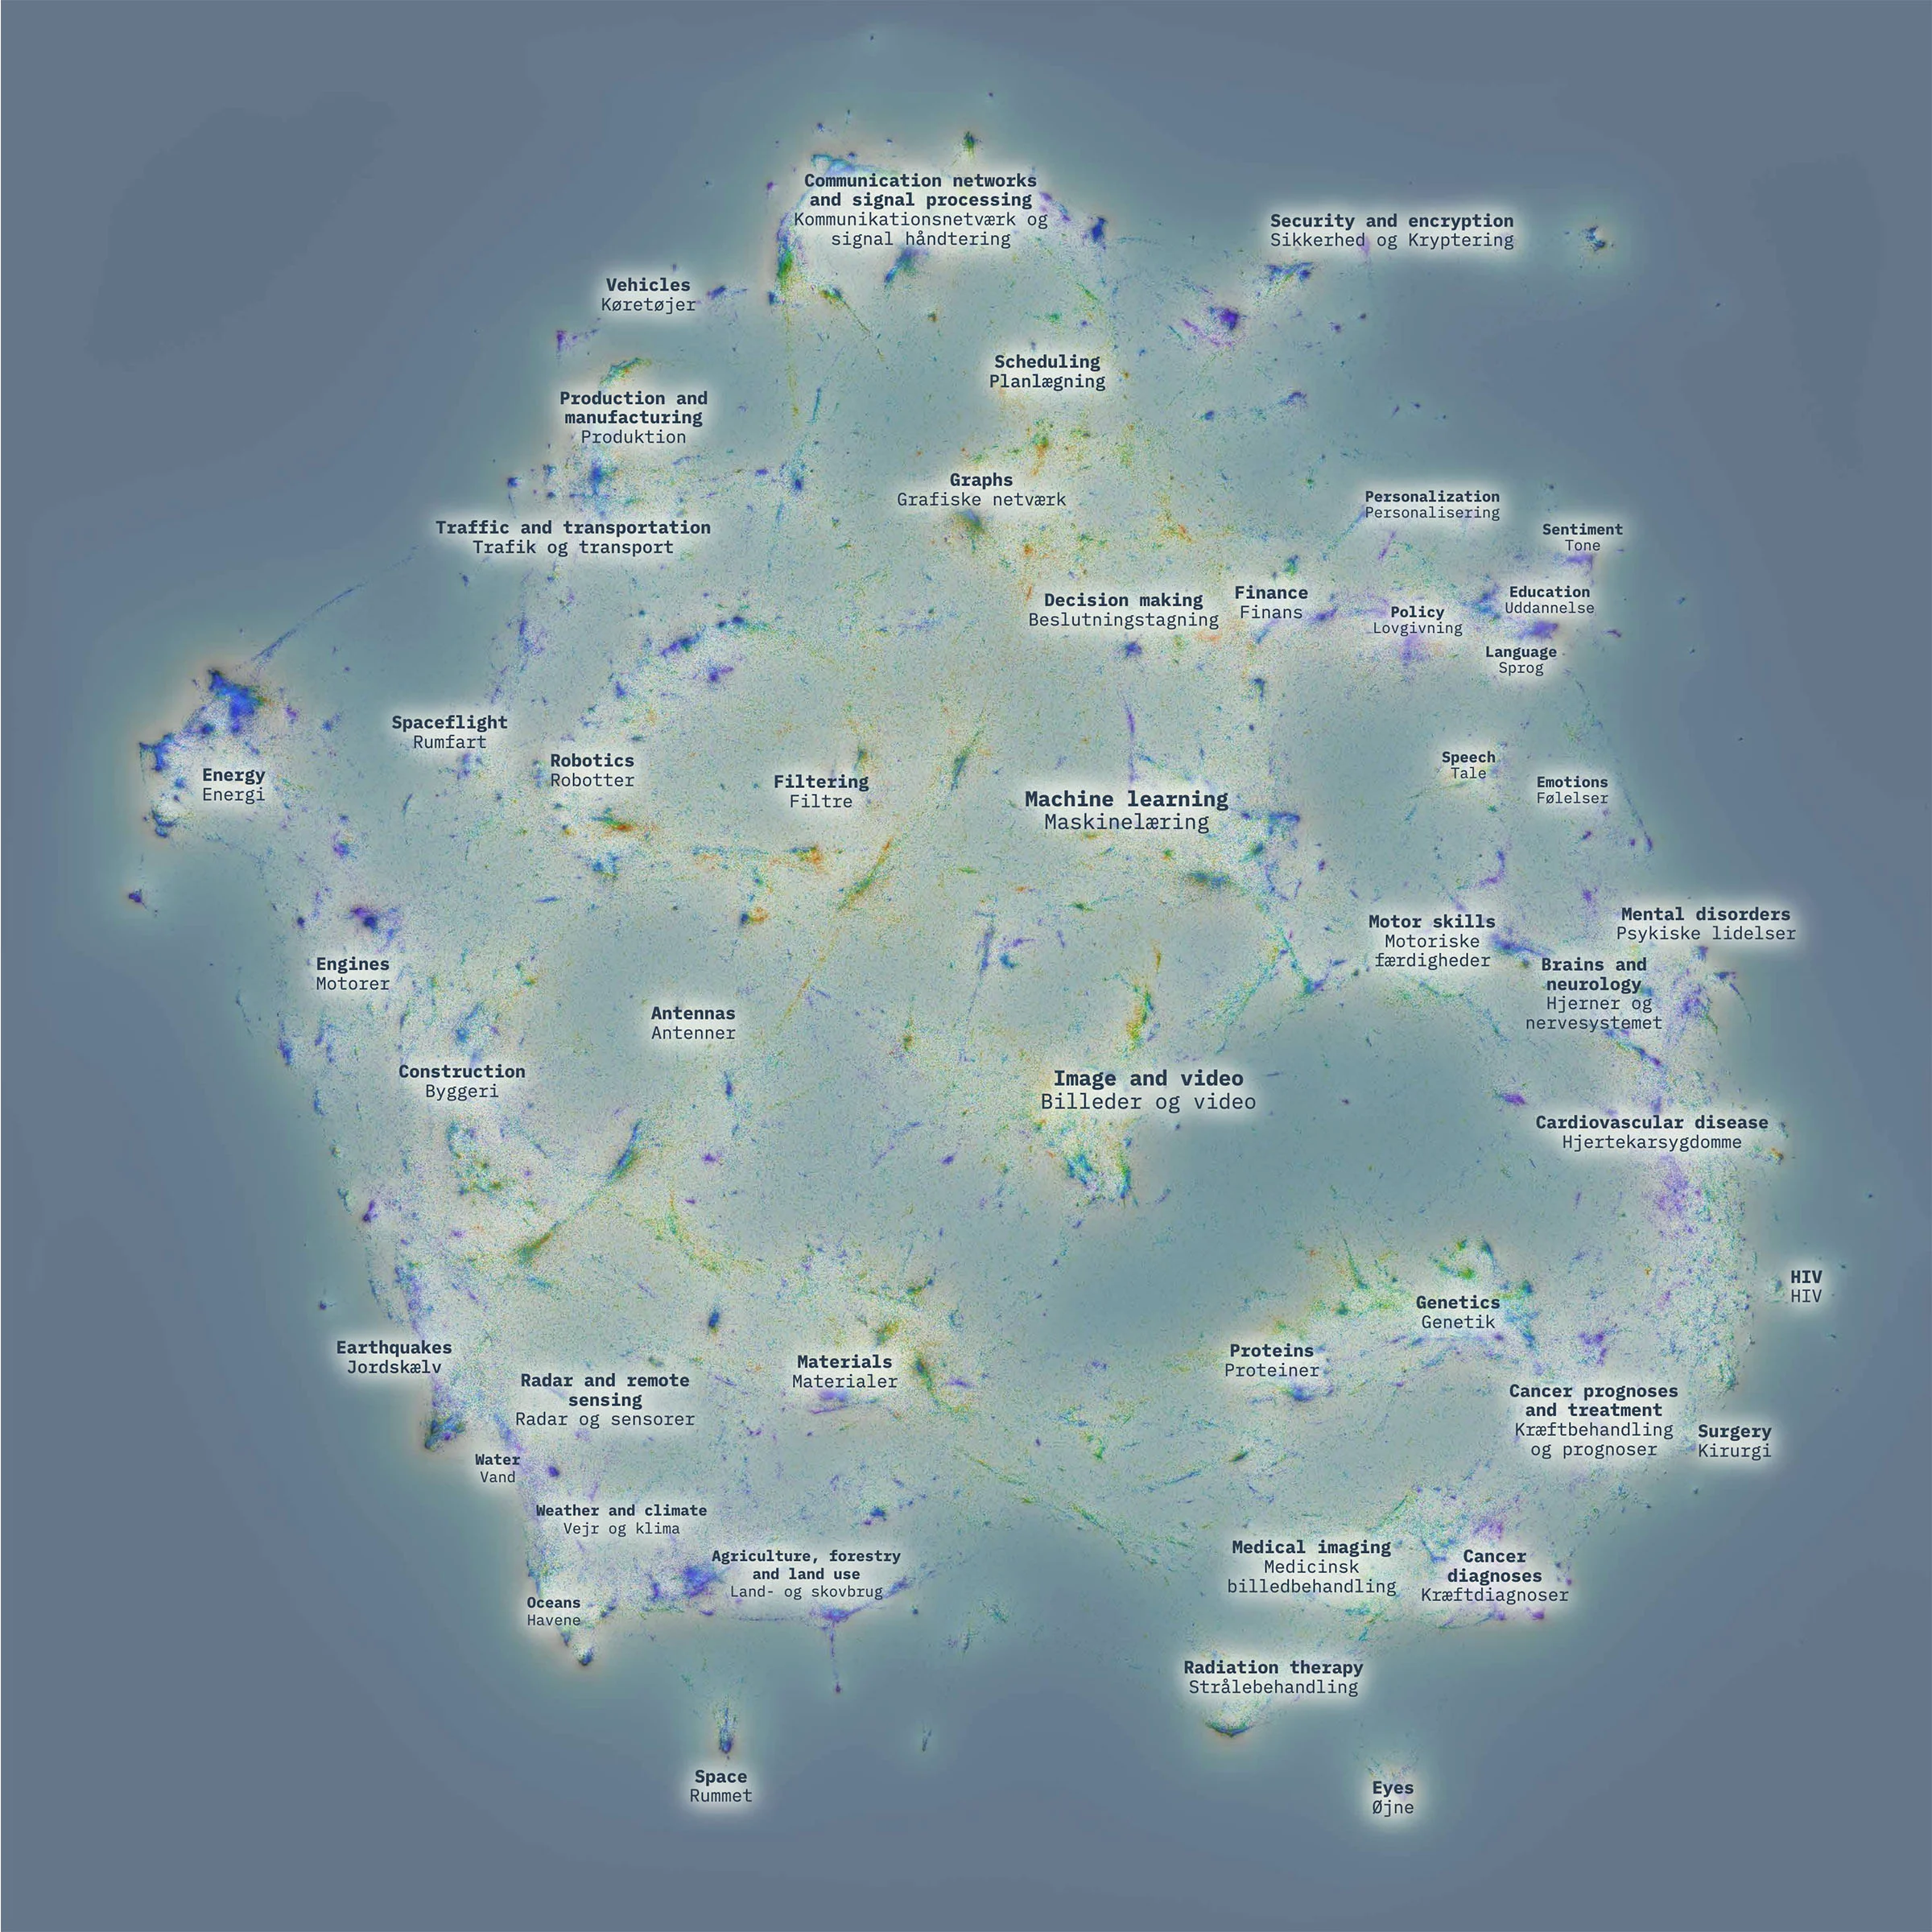
One of the most recent developments in this landscape is the use of artificial intelligence to extend how networks are produced and read. Language models can now label clusters automatically, translating dense relational structures into more interpretable categories (Ficozzi et al. 2025). This opens possibilities for multi-scale interpretation, where different levels of zoom reveal labels tailored to the granularity of the view. McInnes’s Toponymy project illustrates such an approach: it embeds contextual semantics into clustering, enabling hierarchical annotation that adapts dynamically as users move between global overviews and local details (McInnes 2025). Together, these techniques reconfigure the balance between human interpretation and machine annotation: while they offer new ways to scale analysis across vast corpora, they also raise questions about what kinds of meaning are introduced, obscured, or distorted through algorithmic labeling (Munk et al. 2024).
Cultivating network literacy, then, is not only about learning to design or read networks but also about working critically with AI as a collaborator in the production of meaning. For designers, this means making informed and creative choices while remaining attentive to the epistemic and ethical consequences of automated interpretation. Just as reading the codex once transformed cultural literacy, learning to read and question AI-augmented networks may become an equally transformative skill for our age. The challenge ahead is to integrate these tools without erasing human interpretation, ensuring that networks remain spaces for dialogue between computational insight and human imagination.
References
- Barabási, Albert-László. 2002. Linked: The New Science of Networks. Cambridge, MA: Perseus Pub.
- Barabási, Albert-László, Mónica Bello, Julia Kluge-Fabényi, et al. 2020. Hidden Patterns: Visualizing Networks at BarabásiLab. Edited by Alanna Stang and Peter Weibel. Berlin: Hatje Cantz Verlag.
- Bastian, Mathieu, Sebastien Heymann, and Mathieu Jacomy. 2009. “Gephi: An Open Source Software for Exploring and Manipulating Networks.” Proceedings of the Third International ICWSM Conference.
- Blasius, Jörg, and Andreas Schmitz. 2014. “Empirical Construction of Bourdieu’s Social Space.” In Visualization and Verbalization of Data, edited by Jörg Blasius and Michael Greenacre. Boca Raton: CRC Press.
- Bostock, Michael. 2017. “A Better Way to Code.” Medium, April 28. medium.com/@mbostock/a-better-way-to-code-2b1d2876a3a0.
- Bostock, Michael, Vadim Ogievetsky, and Jeffrey Heer. 2011. “D3: Data-Driven Documents.” IEEE Transactions on Visualization and Computer Graphics 17 (12): 2301–9. doi:10.1109/TVCG.2011.185.
- Boullier, Dominique. 2018. “Médialab Stories: How to Align Actor Network Theory and Digital Methods.” Big Data & Society 5 (2). doi:10/gfpmxh.
- Bourdieu, Pierre. (1979) 1984. Distinction: A Social Critique of the Judgement of Taste. Cambridge, MA: Harvard University Press.
- D’Ignazio, Catherine. 2017. “Creative Data Literacy: Bridging the Gap between the Data-Haves and Data-Have Nots.” Information Design Journal 23 (1): 6–18. doi:10.1075/idj.23.1.03dig.
- Dondis, Donis A. (1973) 1975. A Primer of Visual Literacy. Cambridge, MA: MIT Press.
- Duhaime, Douglas. (2017) 2021. PixPlot. Yale Digital Humanities Lab. github.com/YaleDHLab/pix-plot.
- Eco, Umberto. 2009. Vertigine della lista. Milan: Bompiani.
- Euler, Leonhard. 1953. “Leonhard Euler and the Koenigsberg Bridges.” Scientific American 189 (1): 66–72. jstor.org/stable/24944279.
- Ficozzi, Matilde, Mathieu Jacomy, Dario Rodighiero, Anne Beaulieu, and Anders Kristian Munk. 2025. “Grounding AI Map: The Consequences of Living with the Trouble of an Irreductionist Map.” Design et Abstractions, Revue Design Arts Medias, June. journal.dampress.org/issues/design-et-abstractions/grounding-ai-map.
- Grandjean, Martin. 2014. “La connaissance est un réseau.” Les Cahiers du Numérique 10 (3): 37–54. doi:10.3166/lcn.10.3.37-54.
- ———. 2015. “GEPHI – Introduction to Network Analysis and Visualization.” martingrandjean.ch. martingrandjean.ch/gephi-introduction.
- ———. 2021. “Introduction to Social Network Analysis.” Paper presented at the HNR+ResHist Conference, June 30. halshs.archives-ouvertes.fr/halshs-03351755.
- Gray, Jonathan, Carolin Gerlitz, and Liliana Bounegru. 2018. “Data Infrastructure Literacy.” Big Data & Society 5 (2). doi:10.1177/2053951718786316.
- Harman, Graham. 2009. Prince of Networks: Bruno Latour and Metaphysics. Melbourne: Re.press.
- Hobbs, Robert Carleton. 2004. Mark Lombardi: Global Networks. New York: Independent Curators International.
- Jacomy, Mathieu, Tommaso Venturini, Sebastien Heymann, and Mathieu Bastian. 2014. “ForceAtlas2, a Continuous Graph Layout Algorithm for Handy Network Visualization Designed for the Gephi Software.” PLoS ONE 9 (6). doi:10.1371/journal.pone.0098679.
- Latour, Bruno. 2005. Reassembling the Social: An Introduction to Actor-Network-Theory. Oxford: Oxford University Press.
- ———. 2013. An Inquiry into Modes of Existence: An Anthropology of the Moderns. Cambridge, MA: Harvard University Press.
- Lazer, David M. J., Alex Pentland, Lada Adamic, et al. 2009. “Computational Social Science.” Science 323 (5915): 721–23. doi:10.1126/science.1167742.
- Lévy, Jacques, Ogier Maitre, and Thibault Romany. 2016. “Rebattre les cartes.” Réseaux 195 (1): 17. doi:10/ghqdk7.
- Lima, Manuel. 2011. Visual Complexity: Mapping Patterns of Information. New York: Princeton Architectural Press.
- Löwgren, Jonas, and Erik Stolterman. 2004. Thoughtful Interaction Design. Cambridge, MA: MIT Press.
- Maaten, Laurens van der, and Geoffrey Hinton. 2008. “Visualizing Data Using T-SNE.” Journal of Machine Learning Research 9 (86): 2579–605. jmlr.org/papers/v9/vandermaaten08a.html.
- Manovich, Lev. 2018. “Can We Think Without Categories?” Digital Culture & Society 4 (1): 17–27. doi:10/gjt7qq.
- Marres, Noortje. 2017. Digital Sociology: The Reinvention of Social Research. Cambridge: Polity.
- McInnes, Leland. 2025. “Toponymy.” GitHub. github.com/TutteInstitute/toponymy.
- McInnes, Leland, John Healy, and James Melville. 2018. “UMAP: Uniform Manifold Approximation and Projection for Dimension Reduction.” arXiv. doi:10.48550/arXiv.1802.03426.
- Moreno, Jacob L. 1934. Who Shall Survive? Washington, DC: Nervous and Mental Disease Publishing Co.
- Munk, Anders Kristian, Mathieu Jacomy, Matilde Ficozzi, and Torben Elgaard Jensen. 2024. “Beyond Artificial Intelligence Controversies.” Big Data & Society 11 (3). doi:10.1177/20539517241255107.
- Noichl, Maximilian. 2019. “Modeling the Structure of Recent Philosophy.” Synthese. doi:10/ghp7f4.
- Ricci, Donato, Robin De Mourat, Christophe Leclercq, and Bruno Latour. 2017. “Clues. Anomalies. Understanding.” In Designing Interactive Hypermedia Systems, edited by Everardo Reyes-Garcia and Nasreddine Bouhaï. Hoboken, NJ: John Wiley & Sons. doi:10.1002/9781119388272.ch6.
- Rodighiero, Dario. 2021. Mapping Affinities: Democratizing Data Visualization. Métis Presses. doi:10.37866/0563-99-9.
- Rodighiero, Dario, and Jean Daniélou. 2023. “Weather Map: A Diachronic Visual Model for Controversy Mapping.” In Zoomland: Exploring Scale in Digital History and Humanities, edited by Florentina Armaselu and Andreas Fickers. Berlin: De Gruyter. doi:10.1515/9783111317779-017.
- Rodighiero, Dario, Lins Derry, Douglas Duhaime, et al. 2022. “Surprise Machines: Revealing Harvard Art Museums’ Image Collection.” Information Design Journal 27 (1): 21–34. doi:10.1075/idj.22013.rod.
- Rodighiero, Dario, Philippe Rivière, and Sarah Kenderdine. 2024. “Super-Vision: Tracing EPFL History through 8,000 Doctoral Theses.” Journal of Digital History 3 (1). doi:10.1515/JDH-2023-0004.
- Rodighiero, Dario, Eveline Wandl-Vogt, Elian Carsenat, et al. 2022. “Immersive Architectures for Visual Data Literacy.” Information Design Journal 27 (3): 295–308. doi:10.1075/idj.22016.rod.
- Romele, Alberto, and Dario Rodighiero. 2020. “Digital Habitus or Personalization without Personality.” HUMANA.MENTE Journal of Philosophical Studies 13 (37): 98–126. doi:10.5281/zenodo.3950030.
- Sachs, Horst, Michael Stiebitz, and Robin J. Wilson. 1988. “An Historical Note: Euler’s Königsberg Letters.” Journal of Graph Theory 12 (1): 133–39. doi:10.1002/jgt.3190120114.
- Scott, John. 2000. Social Network Analysis: A Handbook. 2nd ed. London: SAGE Publications.
- Shields, Rob. 2012. “Cultural Topology: The Seven Bridges of Königsburg, 1736.” Theory, Culture & Society 29 (4–5): 43–57. doi:10.1177/0263276412451161.
- Venturini, Tommaso, Mathieu Jacomy, Axel Meunier, and Bruno Latour. 2017. “An Unexpected Journey: A Few Lessons from Sciences Po Médialab’s Experience.” Big Data & Society 4 (2). doi:10/gf7tk2.
- Venturini, Tommaso, Anders Kristian Munk, and Mathieu Jacomy. 2019. “Actor-Network vs Network Analysis vs Digital Networks.” In DigitalSTS: A Field Guide for Science & Technology Studies, edited by Janet Vertesi and David Ribes. Princeton, NJ: Princeton University Press.
- Venturini, Tommaso, Mathieu Jacomy, and Pablo Jensen. 2021. “What Do We See When We Look at Networks.” Big Data & Society 8 (1). doi:10.1177/20539517211018488.
- Windhager, Florian, Saminu Salisu, Roger A. Leite, Velitchko Filipov, and Silvia Miksch. 2020. “Many Views Are Not Enough.” IEEE Computer Graphics and Applications, 58–71.