Circulation of Opinions in Visualization Reading
Rodighiero, Dario. 2016. “Circulation of Opinions in Visualization Reading.” In Valuable Visualization of Healthcare Information, edited by Federico Cabitza, Daniela Fogli, Massimiliano Giacomin, and Angela Locoro, 13–19. Bari: CEUR-WS.org. https://ceur-ws.org/Vol-1658/paper3.pdf.
Visualizations need interpretation as a way to grasp the meaning of visual representation. They are complex, and often the process of creation is hidden to the public. Because of this, the following text illustrates a way to read the visual representation of data by analyzing the reading in three intervals: detail, visualization, and context. These three different moments make explicit the structure of reading, which will end with the interpretation—the moment in which the observer gets insights and becomes conscious about a personal kind of knowledge. Interpretation, which is composed of personal opinions, is a very important medium to keep the information circulating and to permit an open dialogue with other observers who are reading the same visualization, even in the medical field. In this paper the photography of Luigi Ghirri will illustrate the schematic approach; successively, the three intervals will be exemplified using a medical example, where my parents will be involved in the reading of a blood test. The simple idea is that, through the circulation of opinions and the dialogue, visualization interpretation will foster the creation of a common knowledge and improve the capacity of reading by each single observer.
Detail, Photograph and Context
Luigi Ghirri wrote a book titled How to Think in Pictures. His way of taking photographs shows a certain way of thinking; for him photography was something to take seriously. Among his invaluable lessons, the thought that photography is essentially an operation of subtraction from the real world stimulated my interest (Ghirri 2010). Removing elements implies choosing what to include in the shot, and consequently the definition of a border begins to form, which distinguishes visible from invisible in the eyes of the photographer. Indeed, Ghirri, thinking as a photographer, created a threshold that is based on a choice made by the author in the moment of the shot. However, once the photograph is printed and spread, the same threshold is offered to an observer—it’s his turn to deal with that by looking at the photograph and reading it.
The act of reading, performed by the observer in front of a text or an image, produces a natural consequence that follows two directions, one toward the detail and the other toward the context. Looking at a photograph, it is clear that someone can understand something meaningful. This is what Roland Barthes named punctum (Barthes 1981). In few words, the punctum is the detail that an observer keeps from an image, when he is no longer in front of it and he thinks back on it. The detail is the meaningful part of the photograph that deserves to be kept in memory and, maybe even more importantly, it is the personal and unique experience which distinguishes the singularity of the observer. Often this detail is significant because it is somehow a part of the observer’s memory and, through it, he creates a genuine relationship with the photograph (Berger 1972).
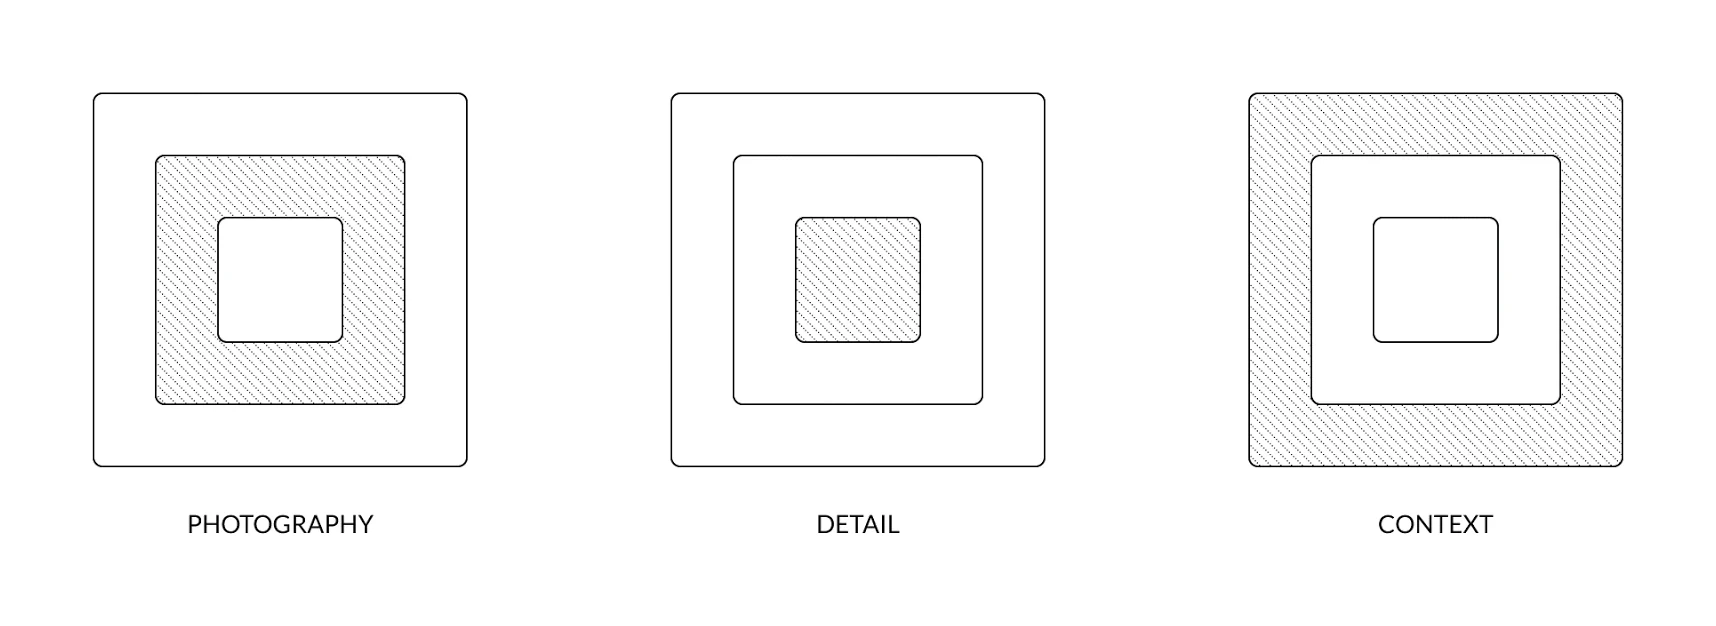
The observer and the photograph are now connected through an element, which projects itself to both sides. This occurs in the photograph as a visual element, and in the person as a reminder of something previously experienced. Indeed, it is part of the personal memory that characterizes each of us. The act of reading is strongly unique because of our memory; it is the memory which gives us the context of reading. Through it, although a threshold limits the vision of photography, the context represents the space where each of us places the photograph to enrich our personal understanding. The reading moves itself from the detail to the context, which is the key to overcome the threshold. It means that with knowledge, memory and previous experience, the observer thinks outside of the borders and repositions the photograph in a private context where he can imagine a world outside the threshold forced by the image. Photograph, details and context are intertwined in three levels as illustrated in the diagram in Figure 1.
For example, looking at this photograph by Luigi Ghirri (Figure 2) could bring us to a couple of outcomes. An observer could look at the snow in the photograph—the detail—and think about his childhood when he used to play with friends during the winter—the context. Another observer could look at the red building on the right of the image and recognize the San Cataldo Cemetery by Aldo Rossi and Gianni Braghieri. There is, in addition to the two interpretations, the choice of Luigi Ghirri to hide a large part of the cemetery; as a result, the red cube, which is the ossuary building, is subtracted from the other buildings of the cemetery to become a relevant element in the picture.
Thus, the snow and the ossuary are details of the same photograph. Even if both belong in the same photograph, they trigger different interpretations: one person thinks about his childhood, one about the architecture. Moreover, for the photographer the ossuary represents an element isolated to being part of the pictorial composition. Two details for three different examples of context.

Uncertain Visualization
Photography is just one of the varieties of representation devices used in science, among these are diagrams, networks, graphs, maps, documents, computer applications, recordings, data, etc. One possible device corresponds to visualizations. Lev Manovich employs visualization to indicate “situations when quantified data which by itself is not visual […] is transformed into a visual representation” (Manovich 2002). Visualizations are instruments widely accepted in science, their use has become increasingly frequent during the last few years, even if it is still controversial. Indeed, visualizations can be easily misunderstood; sometimes they are used to be misleading, and often readers are misinformed about how a particular visualization is created, through which process, for what reason, for which audience, or with which data (Dörk, Carpendale, and Williamson 2012). Due to this, visualizations are interpreted in different ways and the interpretation is uncertain.
Recent studies in Digital Humanities claim that each person has an individual way of understanding visualizations (Drucker 2011). Johanna Drucker thinks about visualizations as objects that can be examined with a humanist approach, arguing that visualizations are not faithful representations of reality. The process of translation from the reality to the pictorial representation shows a lack of information and a forced simplification, and this is innate in the medium because the data employed simplify the reality. For this reason, visualizations are uncertain, imprecise and especially open to interpretation. Hal Foster touched on this argument years ago, when he introduced the notions of vision and visuality (Foster 1988). For Foster, the vision is the sense which allows human beings to see, the visuality is the personal interpretation of what human beings see. The point is that there is still no method to understand visualizations now, and the variety of interpretations makes any result unpredictable and unclassifiable (Lury 2014). Foster points a deficit in the study of visual reading, saying that semiotics cannot be the only way to look at images and, consequently I would add, visualizations.
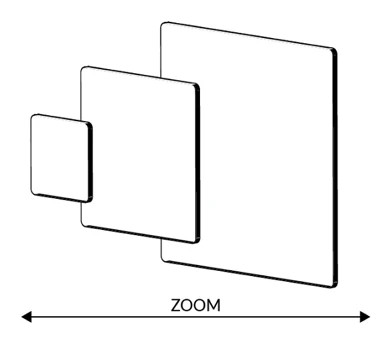
The schema previously illustrated shifts to visualization, and the intervals become detail, visualization, context. The visualization substitutes the photography because interchangeable representation devices are used in science. The schema helps to consider the act of interpretation at different levels. The detail defines an element of the image that someone notes for personal interest, the visualization represents data which people look at—the vision, and the context is the distinctive background that brings the observer to a subjective interpretation—the visuality. Nevertheless, the context has blurred edges because it can overlap with other contexts belonging to different people. That is an important fact because observers can agree on a common concept, a shared idea, or a controversy. Detail-visualization-context sequence can be seen as a scale, from the personal view to the collective one, like a visual technology capable of zooming from the detail to the context, from the particular to the whole—an instrument to improve comprehension of interpretations. To guess what Figure 3 would represent, you probably have to refer to the book Cosmic View of Kees Boeke (Boeke 1957) or to the marvelous documentary films written and directed by Charles and Ray Eames, the Powers of Ten (Eames and Eames 1977).
Circulation of Opinions
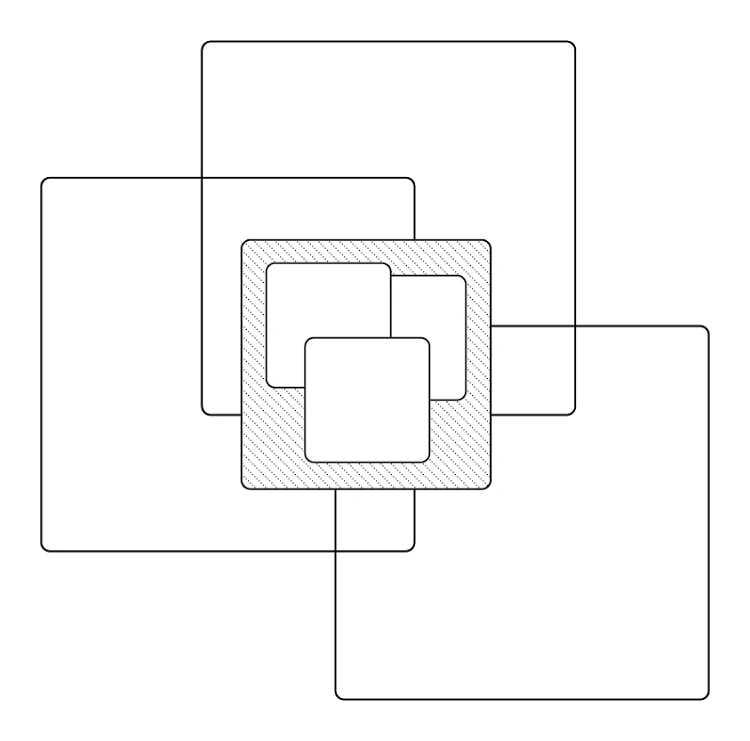
Through the zoom each observer moves from details to contexts and vice versa, but what happens when the different movements of zoom coexist in the same space? Observers cross each other in the space where the visualization extends itself between contexts and details, where each interpretation is the terminus of a trajectory (Stafford 2005), where the act of intersecting distinguishes a shared knowledge. Visualizations can be shared and details can be shared, but contexts can especially be shared. For example, in the photography of Ghirri (Figure 2) the two observers could agree that a red building is visible on the image, their controversy is about the fact that it is a cemetery because the detail is shared, not the context. The first observer, even if he doesn’t know the building, argues that its shape is so unreal that it cannot be a cemetery. The second observer, being an architect, recognizes very well the shape for which he studied a lot at the faculty. In this specific moment of controversy, a discussion begins; it is lively, if not long. The second observer opens a Wikipedia page to find the reason behind the picture.
The point is that images are not immobile objects still in the space, they are free to move around people (Mondzain 2010). They circulate, in fact they have to circulate to be visible and accessible, but even the context can be seen as a movable entity (Latour 1986). The context, intended as the knowledge that allows someone to read a visualization, is movable and dynamic through the discussions of people. To be precise, the context has two major moments, the first when the observer translates the detail into an opinion which belongs to the context, the second when he changes his opinion after a discussion, or vice versa. Opinions have to circulate among observers because they have to converge toward a discussion, this is the moment when they can be considered common knowledge and influence other readings afterward. This is the mechanism to exemplify the complexity of a collective reading, and it could be the key that can shift the attention from the visualization to interpretation.
A Medical Example
Once my father did a blood test, a simple examination in order to get information about his medical condition. Sometimes my father could appear to be a hypochondriac; it is not always the case, but at that time he did seem that way. My father went to the hospital, did the blood collection, and then received the results at home after a few days. The letter contained a table of the results; each value was within the limits, except one. My father, who for this occasion was very much being a hypochondriac, was seriously worried. He made the week before the doctor’s appointment very stressful for my mother because one value was past the limit. After one week elapsed, my father went to the following appointment. Once he entered the doctor’s office, he started asking a series of questions—with my mother looking embarrassed. At a certain point the doctor stopped my father and said, “Dear Claudio, your medical condition is extremely good for a man of your age. You’re simply becoming old, and you don’t have to worry about this blood value.” After a while my father was euphoric and felt healthy again, and my mother finally relaxed.
The Analysis
In this example, there are three actors: my father, my mother and the doctor. Each of them sees a different detail in the blood test. My father is concentrated on the value which exceeds the limits, whereas my mother and the doctor concentrated on the whole result. However, the discussion between my mother and my father is not helpful for reaching an agreement and having the same opinion, even if the argument of my mother is fair. Often opinions do not agree and stay diverged. With the entrance of a third actor, the doctor, something changes. He has an interpretation similar to my mother, but, on the contrary, because his opinion is characterized by an authority in this specialized area of medicine, he consequently creates a different point of view in the eyes of my father. For this reason, the discussion between my father and the doctor has a different result—it ends with an agreement. The doctor is able to change the opinion about the blood test of my father through his knowledge and his position as a specialist. Possible arguments and tactics during a discussion are multiple, but this is not the point of this text. What is important is the creation of knowledge, the modification of opinions, or, in other words, the circulation of interpretation between people. Contexts have to be fluid, movable and dynamic; discussions are never static, in every controversy there is a movement of the frontier which limits the two opinions (Latour 2010).
Conclusion
This text represents the effort to see an intersection between Data Visualization and Digital Humanities. Visualizations will have an important role in the future (Foster 1996), and probably a big role. They will be an obliged transition in the representation of complex data, which motivates the need of a humanist approach to read them. Visual Culture, a research domain whose interest is to comprehend how people interpret images, could give an important contribution to the creation of social spaces aimed to the comprehension of visualizations. Medicine needs, more than other disciplines, clarity in the interpretation and the discussion of images (Tuckett 1985). For this reason, digital humanists can contribute more than others to the comprehension of the new generation of digital visualizations of data.
References
- Barthes, Roland. 1981. Camera Lucida: Reflections on Photography. New York: Hill and Wang.
- Berger, John, ed. 1972. Ways of Seeing: Based on the BBC Television Series Directed by Michael Dibb with the Participation of John Berger. London: British Broadcasting Corporation and Penguin Books.
- Boeke, Kees. 1957. Cosmic View: The Universe in 40 Jumps. New York: The John Day Company.
- Dörk, Marian, Sheelagh Carpendale, and Carey Williamson. 2012. “Visualizing Explicit and Implicit Relations of Complex Information Spaces.” Information Visualization 11 (1): 5–21.
- Drucker, Johanna. 2011. “Humanities Approaches to Graphical Display.” Digital Humanities Quarterly 5 (1): 1–21.
- Eames, Charles, and Ray Eames. 1977. Powers of Ten.
- Foster, Hal, ed. 1988. Vision and Visuality. Seattle: Bay Press.
- Foster, Hal. 1996. “The Archive without Museums.” October 77: 97–119.
- Ghirri, Luigi. 2010. Lezioni di fotografia. Macerata: Quodlibet.
- Latour, Bruno. 1986. “Visualization and Cognition: Drawing Things Together.” In Knowledge and Society: Studies in the Sociology of Culture Past and Present, edited by Henrika Kuklick, 6:1–40. Greenwich, CT: JAI Press.
- Latour, Bruno. 2010. Cogitamus: six lettres sur les humanités scientifiques. Paris: La Découverte.
- Lury, Celia. 2014. “Double Blind, Double Bind: The Plane That Disappeared (a Problem of First and Second Order Observation)?”
- Manovich, Lev. 2002. “Data Visualization as New Abstraction and Anti-Sublime.”
- Mondzain, Marie-José. 2010. “What Does Seeing an Image Mean?” Journal of Visual Culture 9 (3): 307–315.
- Rigal, Alexandre, Dario Rodighiero, and Loup Cellard. 2016. “The Trajectories Tool: Amplifying Network Visualization Complexity.” Paper presented at Digital Humanities 2016, Kraków, Poland, July 12.
- Stafford, Barbara Maria. 2005. “Presuming Images and Consuming Words: The Visualization of Knowledge from the Enlightenment to Post-Modernism.” In Consumption and the World of Goods, edited by John Brewer and Roy Porter, 462–477. London: Routledge.
- Tuckett, David, ed. 1985. Meetings between Experts: An Approach to Sharing Ideas in Medical Consultations. London and New York: Tavistock.